


 Upcoming Events
 Event Series
 On-Demand Events


Video Metrics That Drive Pipeline (and How to Measure Them)

Table of Contents
Maximize Your Marketing ROI
Join 10,000 other marketers already getting the best tips on running engaging events that boost pipeline and create raving fans.
500 people just watched your video. Nice! But which accounts actually watched? Who on the buying committee engaged? What content kept them watching, and what made them bounce?
And most importantly, did any of that viewing behavior actually impact pipeline?
If you can't answer those questions, you're tracking vanity metrics—not video intelligence.
And the gap is widening. While production is scaling, most teams still can't connect video engagement to revenue. The performance metrics that matter are buried in disconnected tools or missing completely.
This guide shows you which video marketing metrics predict pipeline, and how to build a measurement system that connects engagement to revenue.
Stop guessing which accounts are ready to buy. See how Goldcast tracks engagement at the account level and automatically alerts your sales team when prospects watch your content.
Why video metrics are the missing link in your marketing strategy
90% of marketers are already repurposing video content across channels—turning webinars into social clips, podcasts into blog posts, and demos into nurture sequences.
A single recording can generate dozens of high-impact touchpoints across the buyer journey.
But most teams are still measuring video like it's 2020: counting video views, tracking completion rates, and calling it a day.
The teams pulling ahead are connecting core video metrics with a deeper set of signals:
- Account-level consumption: Not "500 people watched"—but "which target accounts watched, and who from their buying committee engaged?"
- Cross-content behavior: Did someone who watched your product demo also consume a customer story? That's intent.
- Time-to-pipeline: How long between first video view and opportunity creation?
B2B teams using account-level video analytics are seeing measurable impact in specific segments and target audiences.
Uber for Business increased pipeline influenced by webinars by 25%. Hootsuite grew organic traffic to webinar pages by 150% by tracking on-demand engagement. The list goes on.
When your video platform can automatically route intent signals to sales and tie consumption to revenue, measurement becomes an advantage instead of a surface-level reporting chore.
➡️ Are you sitting on untapped video content? Companies now host an average of 4 webinars per month. Don’t let content gold go to waste. This guide makes repurposing easy.
Turn your best webinar moments into weeks of content. See how Content Lab automates repurposing.
Which video metrics correlate with pipeline performance?
Views, likes, social sharing—these are all great signals. But without deeper context, they can’t tell you how (or even if) viewership translates to pipeline.
The metrics that correlate? They measure depth of engagement, replays, repeat behavior, and account-level patterns you can act on.
Here are the top video metrics to watch.
1. Account-level view count (who's watching, how often)
Raw view count is a vanity metric, until you add context.
Top performers are repurposing video content across channels, turning one webinar into 30+ derivative assets for decision makers to engage with.
Top distribution channels:
- Social media (87%)
- Landing page (46%)
- Email campaigns (44%)
In a zero-click environment where buyers deep dive into research without ever filling out forms, traditional tracking isn’t an option.
You need to know:
- Direct traffic patterns: Are target accounts visiting your site after video campaigns? Get the right UTM parameters in all the right places.
- Return visitor rates: Are people coming back for more content?
- Account penetration: How many video viewers from the same company are engaging?
YouTube and Google Analytics are great, but don’t stop there.
With an integrated video stack, if you see that a contact from Acme Corp watched your product demo YouTube video, shared a customer story on LinkedIn, and three of their team members engaged with your Reels cut on Instagram, you know that’s not three disconnected data points. It's a coordinated evaluation.
The best platforms unify engagement data into one account, so you can see the full picture of buying committee activity.
✅ Action item: Create a sales alert system based on account-level viewing behavior. Set triggers for when a target account watches 2+ videos in 7 days, downloads a resource, or returns for a second session.
For experts like Rachel Truair, CMO at Demandbase, success with any program is all about tuning into what’s happening at the account level:
2. Behavioral engagement (intent signals, not vanity metrics)
You already know video drives more engagement on social media platforms, but here’s the latest from LinkedIn:
- Videos are shared 20x more than any other content
- Authentic emotion increases engagement with brand awareness videos by 78%
- Expert takes increased video engagement by 40%
But the best teams don’t just track total number of shares and likes. They use video engagement data to decide what to repurpose across channels.
When you can see which 90-second segment of your webinar drove the most chat activity, that's your next TikTok or LinkedIn clip. Spot a question that came up three times? That's your next FAQ video.
From your LinkedIn video ads to your content strategy, the way people engage with your videos can tell you a lot about how to shape your marketing strategy.
✅ Action item: Identify your highest-engagement webinar moments, then turn them into a multi-format asset pack—social clips, email teasers, blog embeds—that extends the life of your best content. Box does this systematically, turning every major event into months of content.
3. Conversion rate mapped to buyer journey stage
Data shows that videos can increase landing page conversion rates and influence vendor selection.
But optimizing conversion rates is more than A/B testing your CTA buttons. It's about context and timing.
Here’s what the data has to say:
- 89% of businesses use video in their marketing mix
- Short-form videos (under 60 seconds) get the highest engagement
- Webinars and product demos deliver the strongest ROI for B2B
But video length isn't everything. 52% of buyers prefer concise videos that "get to the point quickly," which means your 5-minute product explainer might outperform your 45-minute deep-dive—if you're targeting early-stage buyers.
Action item: Map your video content to funnel stage. Use short, punchy videos (under 3 minutes) for brand awareness and consideration, then deploy longer, detailed content for decision-stage prospects. When analytics show someone watching your deep-dive content, that's your signal to sales: this account is ready to progress.
Trinity Nguyen, CMO and AI GTM at UserGems recommends starting small:
4. Play rate by page type and buyer intent
Play rate tells you whether your video even gets a chance.
Play rate = (video plays ÷ page visitors) × 100
If your video isn't optimized for vertical viewing with eye-catching thumbnails, you're losing plays before you even start.
On average, over one in five people (20%) who come across a video choose to watch it. But placement makes a massive difference.
- Videos get the highest play rates on:
- Course pages (viewers are there to learn)
- Video galleries (obvious intent to watch)
- Contact pages (high-intent visitors already evaluating you)
Someone on your contact page is already bought in. Someone reading a blog post? They came for text, so your video needs to work harder to earn a play.
✅ Action item: If your play rate is below 15%, test new thumbnails. Use faces, bold text overlays, and visual hooks that show value in under 2 seconds.
- Bold color palettes in video thumbnails (+15% engagement, per LinkedIn research)
- Dynamic typography that's readable on mobile (+14% engagement)
- Clear sequencing so viewers know what they're about to watch (+15% engagement)
Make every touchpoint feel authentic with fully customized branding for all your video content.
5. Completion rate segmented by account value
Completion rate is critical to understanding viewer experience and audience retention. It signals whether your content is worth your prospect’s time, or if consistent drop-offs are preventing them from taking the desired action.
Completion rate = (viewers who watched to the end ÷ total viewers) × 100
Looking at low completion? Either you buried the value too deep, or the content didn't match viewer expectations. Come back at it with fresh eyes.
Finding the right video length can be tougher than it seems. Short-form video saw a 48% lift in click-through rate (CTR) year-over-year, while long-form webinars continue to drive the highest B2B conversion rates.
The long-game winners will use both. Brands will use short clips to drive awareness and long-form content to close deals, with agentic AI bridging the production gap between the two.
The format factor: LinkedIn research shows that "real talk" videos (vertical, mobile-native, featuring authentic speakers) deliver 103% higher dwell time than generic corporate content, while "blockbuster brand films" (horizontal, cinematic, story-driven) achieve 129% higher engagement when targeting awareness-stage buyers.
✅ Action item: Stop treating completion rate as a single number. Segment by content type and funnel stage. Your 20% completion on a 60-minute webinar might be great if those 20% are all ICP accounts.
Video benchmarks: What "good" looks like
A "good" video strategy varies wildly by content type, industry, and funnel stage. But it can still be helpful to have a baseline.
Below are some broad benchmarks derived from our analysis of 19,000+ B2B webinars, validated against industry data from Wistia, LinkedIn and other sources.
Video metrics benchmark table
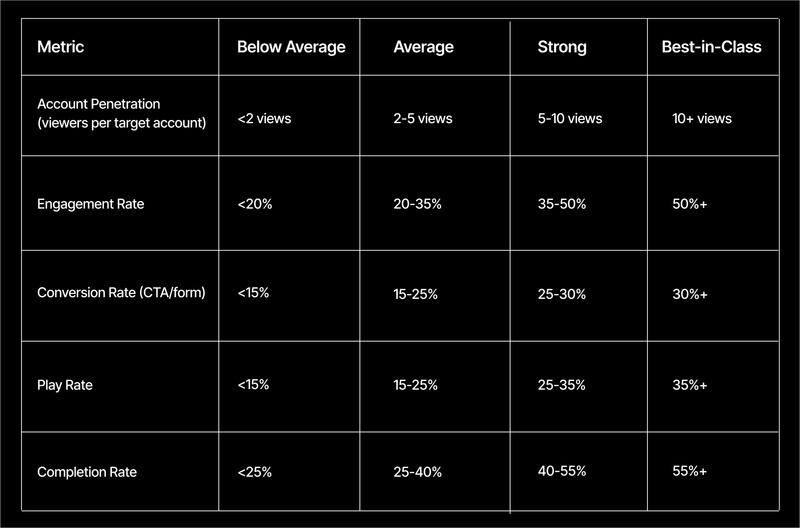
Sources: Goldcast 2025 B2B Webinar Benchmark Report, industry aggregated data
As always, take this with a hefty grain of salt. The most valuable benchmark is your own baseline.
Track your numbers over time, identify what moves the needle for your business, and optimize from there.
Here’s how Devin Reed explains his approach to creating channel-specific metrics:
The video framework that actually works
Your video got 1,000 views. You closed three deals that month. Are those two things connected?
Most teams can't say for sure. The following principles will help you build a framework that goes beyond broad demographics and average view duration to in-depth insights that deliver real return on investment.
Treat video engagement as a leading indicator
In the new world of B2B, video engagement is a leading indicator—not a trailing one.
Someone watches your webinar today. They don't request a demo until three weeks later. If your attribution window is only 7 days, you'll completely miss the connection.
The data shows clear patterns:
- Enterprise deals: Video engagement leads pipeline by 2-4 weeks
- Mid-market: 1-3 weeks between first video view and opportunity creation
- SMB: Typically 1-2 weeks, with faster decision cycles
Video is often the first meaningful interaction that moves an account from passive awareness to active evaluation. Someone might see your brand mentioned in passing, but watching a 45-minute webinar signals real intent.
We should be clear: the goal isn't perfect attribution. That's impossible in complex B2B sales. The goal is proving video drives pipeline with enough confidence to secure budget and scale what works.
When you can prove that accounts who engage with video content convert 3x faster or have 40% higher deal sizes, you're not arguing for resources—you're defending them.
Here’s how Ashley Faus, Head of Lifecycle Marketing, Portfolio at Atlassian explains it:
Sharpen your scoring model
Not all engagement is equal. Same is true for video.
A prospect who watches 60% of your product demo, downloads three resources, and returns the following week signals far higher intent than someone who watches 90% of the same video but never comes back.
Build your scoring model by prioritizing behaviors based on intent:
- High-intent signals: Return visits, resource downloads, Q&A participation, call-to-action (CTA) clicks
- Medium-intent signals: 50%+ completion rate, poll participation, chat engagement
- Lower-intent signals: Initial views, partial completion, passive viewing
With deep video automation and integration, that's not a cold lead—that's a qualified buyer who's actively in evaluation. Reps can go straight to the specific features that held their attention.
That’s how brands like Tackle.io influenced 57% of new business pipeline—by connecting video engagement to account-level intelligence and giving sales the context to convert.
Operationalize video insights
The gap between average and best-in-class isn't about tactics—it's about what they measure.
Most teams track total views and call it a win. The best teams track account-level buying signals and act on them.
Here's what that looks like in practice:
- Instead of: "Our webinar got 500 views"
- Ask: "Which 23 target accounts watched, and how many people from each buying committee engaged?"
- Instead of: "Engagement was up 20%"
- Ask: "Are we reaching economic buyers, technical evaluators, and end users—or just one persona?"
- Instead of: "Completion rate is 35%"
- Ask: "How quickly are high-value accounts moving from awareness content to decision-stage deep dives?"
The top-performers aren't the ones with the biggest video budgets—they're the ones who can connect video engagement to revenue with confidence.
Not sure where you stand? Here are some questions to consider:
- Can you name the last three target accounts that watched your flagship video?
- Does your CRM automatically update when a prospect returns for a second video?
- When a buying committee member watches your pricing webinar, does your sales team know within the hour?
If you answered "no" to any of these, you could be measuring activity instead of intent.
Here’s Alex Rynne, Senior Content Marketing Manager, Marketing Solutions, LinkedIn, on why it’s important to go back to your goal when setting your video benchmarks:
No more shallow engagement data. Goldcast tracks poll responses, Q&A questions, resource downloads, chat activity, watch time, drop-offs—everything that indicates intent.
Make your metrics matter
Most B2B teams are drowning in tools but starving for insights. They export CSVs, manually map data between tools, and call it integration.
By the time you build a report, the intel's stale.
The new approach? Video engagement flows directly to your CRM, lead scores update automatically, and sales gets Slack alerts for hot accounts within minutes.
And there’s a bonus: when everything lives in one system, AI can actually work. It has full context, complete data, and can execute multi-step workflows that actually save you time.
Get one dashboard that shows everything from live webinar engagement, on-demand viewing, Video Hub consumption, and social distribution.
In Goldcast, native integrations with Salesforce, HubSpot, and Marketo push engagement data into your CRM and account-level engagement syncs to opportunity records in real time.
Viewing behavior updates contact scores and Slack alerts notify your team when target accounts engage so you can act instead of analyze.
Learn how brands like UberBusiness, Intercom, and Kochava are scaling video with Goldcast.
FAQs
1) Which video metrics best predict pipeline impact?
Account-level consumption patterns and repeat viewing behavior are your strongest signals. Look for rising completion rates on long-form content combined with high-intent actions like resource downloads, Q&A participation, and return visits. When prospects consume multiple videos across your library, that's buying intent.
2) How quickly can I access video performance data in Goldcast?
Under 2 hours. Real-time metrics are available during live sessions, with complete analytics—including account-level engagement and CRM sync—accessible before your sales team's lunch break.
3) What dashboard shows cross-event performance trends?
Goldcast's analytics dashboard shows both individual event performance and organizational trends across your entire video library—webinars, demos, and on-demand content in one view.
4) How do I use AI recommendations to optimize performance?
Goldcast's AI identifies your highest-performing segments and recommends what to repurpose, which thumbnails to test, and when to distribute. See how Goldcast AI analyzes your video performance.
5) What's the best way to track video ROI across channels?
Connect video data directly to your CRM. Goldcast's native integrations with Salesforce, HubSpot, and Marketo unify analytics from live events, on-demand viewing, and social distribution—tracking each touchpoint from first view to closed deal.
Transform Your Video Marketing with AI
Stay In Touch
Platform
Resources
Company
© 2026 Copyright Goldcast, Inc. All rights reserved.
YOUR PRIVACY CHOICES