Need to Showcase ROI? Blow Your Boss Away With These 9 Virtual Event KPIs

Table of Contents
Maximize Your Marketing ROI
Join 10,000 other marketers already getting the best tips on running engaging events that boost pipeline and create raving fans.
Congrats, you just pulled off an amazing virtual event!
The event featured a solid speaker line-up, and you managed to rope in some top brands as sponsors. The turnout was great as well! Everyone was happy at the end of the event. All in all, you can call it a success.
While this indeed paints a positive picture, it helps to have data by your side to know just how well the event fared. Plus, data also makes it easier to communicate the event performance to the higher-ups. Where words fail, data speaks.
That’s where Key Performance Indicators (KPIs) come in handy. KPIs help you decide what success looks like for your online event. And with the advanced analytics features in virtual event platforms and deep integrations with other marketing tools, performance tracking has never been easier.
In this article, we’ll look at nine KPIs across the entire sales funnel that can help you track your virtual event ROI. Let’s dive in!
Here’s what we’ll cover:
- Event registrations
- Event attendance
- MQLs
- Event engagement
- SQLs
- Pipeline
- Attendee satisfaction
- Revenue
- Return on investment
Top-of-the-funnel (TOFU) virtual event KPIs
We start at the top of the funnel—the very beginning of the event.
At this point, you’re really looking to see how well your event is aligned with your target audience. Are you reaching the right people? Are they registering for your event? And once they register, are they showing up?
Here are a few examples of KPIs for the top of the funnel:
1. Event registrations: Is this topic relevant?
🔍 Where to find: Event platform analytics; website analytics platform
Nothing gives marketers a rush quite like seeing event registration roll in. This is often the very first metric that teams look at to gauge the success of an event—but don’t let this KPI live alone in a silo.
At a high level, event registrations can tell you whether or not your event topic is relevant and if you’re reaching the right audience.
If you've been running events for a while, you can compare this metric across all events to see the topics your audience prefers. You can also use the event with the highest number of registrations as the benchmark against which you can compare other events.
Another way to use this data? Compare the number of registration page visits to the number of people that actually register for the event. This ratio will give you a conversion rate, which can be helpful for optimizing your landing page experience.
Viewing this data as a percentage provides a holistic view of performance. For example, while two events may have the same number of registrations, the number of visitors on the registration page will determine which event had a better conversion rate.
2. Event attendance rate: Is this the right time?
🔍 Where to find: Event platform analytics
Driving registrations for an event is one thing, but getting folks to show up on the big day is another feat entirely.
The event attendance rate is arguably more important than the total number of registrations. Without attendance, registrations are purely an empty vanity metric.
So how can you calculate the event attendance rate? Simply divide the number of event attendees by the number of event registrations. Of course, your event platform should do this for you. 😉
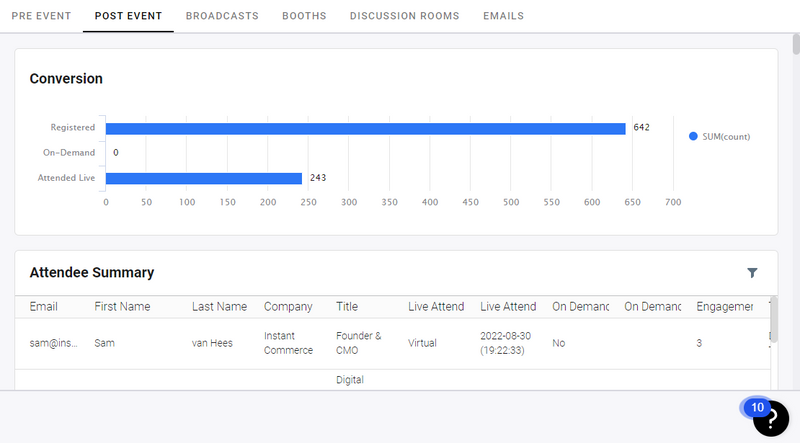
Because there could be a significant amount of time between registering for the event and the actual event, you can understand how effective your event marketing efforts are through this KPI.
If you start seeing a dip in your event attendance rate, you might need to work on creating a better event marketing strategy that turns registrants into attendees.
📈 Attendance rates dropping? Learn three ways to pick up the pace and drive more active attendees to your next virtual event.
3. Marketing qualified leads (MQLs) created: Are we reaching the right people?
🔍 Where to find: MAP; CRM
How can you know if your event content is attracting and resonating with the right audience? MQLs to the rescue!
An MQL is a lead that is interested in your content or solution but isn’t quite ready to buy just yet.
What qualifies a lead as an “MQL” is different for every company, though it is usually determined by sales and marketing departments based on a set of criteria. These criteria are then used for lead scoring through a CRM platform.
For example, while virtual events can attract attendees across the globe, an attendee would be considered an MQL only if they fit in the defined demographic, geographic, and firmographic characteristics.
💯 Learn more about how to use events for lead scoring.
Middle-of-the-funnel (MOFU) virtual event KPIs
In the MOFU stage, you have registrants who are attending the event. In this stage, the leads have a problem or need information and are learning more about you through the event. It all boils down to nurturing your audience here.
The following KPIs are useful in the MOFU phase:
4. Event engagement: Is the content resonating?
🔍 Where to find: Event platform analytics
Engagement is the name of the game when it comes to keeping attendees active and attentive during virtual experiences. But what is “engagement,” really?
Simply put, engagement is the ability for attendees to interact with the speakers, the platform, and other attendees during an event.
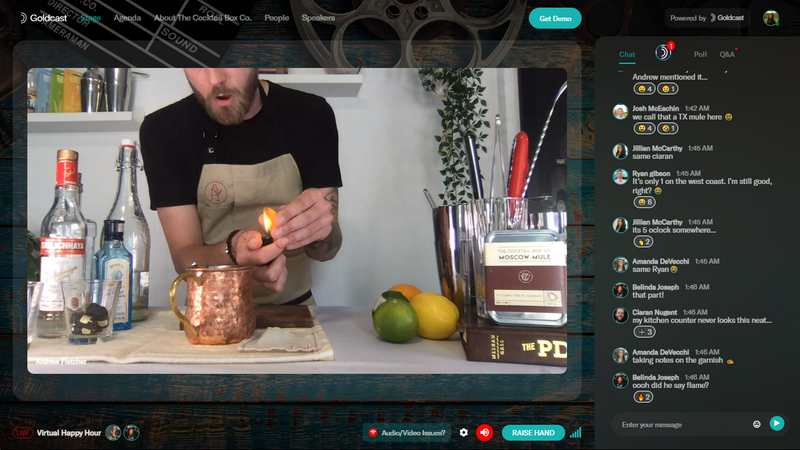
And while audience engagement might seem easier for in-person events, don’t throw in the towel for virtual events. There are many ways to keep folks engaged during virtual events. Live chat, polls, video Q&A, and even embedded apps for things like photo booths or games are just a few examples of how to keep attendees engaged during an event.
And remember, all of this engagement data can be tracked and fed into your CRM for lead scoring.
Another way to measure engagement is to track the total time spent in an event. The longer an attendee sticks around, the more engaged they are.
This is especially handy if your event has more than one session. Pay special attention to sessions with the highest and lowest time spent in the event. This will quickly tell you what content attendees found most interesting—and what content was a miss.
🎮 Looking to really up the engagement ante? Try a few of these event gamification techniques.
5. Sales qualified leads (SQLs) created: Is the event creating sales opportunities?
🔍 Where to find: MAP; CRM
An SQL is essentially a prospect. By synching attendee data from the event marketing software to your marketing automation platform and CRM, you can easily track activities and behaviors that indicate when someone is ready for outreach.
In lead scoring, you award numbers to each favorable activity (signing up for a demo) and characteristic (working at a specific organization). By combining lead scores with event engagement data, you can identify attendees or leads that are ready to be handed off to sales.
⚡️ Speed to lead just got even faster! Check out the new Goldcast + Slack + Salesforce integration
6. Pipeline: Is the event giving our audience the information they need to move forward?
🔍 Where to find: MAP; CRM
Events are kind of like speed dating. This might sound like a wild analogy, but hear us out…
Dates are all about “fit.” Do this person’s values align with my own values? Am I having a good time? Does it just feel right?
Similarly, events allow audiences and prospects to quickly see if a solution feels like a good fit. And they allow marketers and salespeople to qualify leads almost instantly—just like a first date.
If an event goes well, an attendee is more likely to continue to engage with your brand. They’re more likely to convert to a paying customer. And they’re more likely to renew a contract and remain loyal.
This is what pipeline creation is all about—moving folks with intent closer to the finish line. You can measure this by looking at the various stages attendees were at prior to an event and following how they move through the sales cycle post-event.
Again, your CRM is your friend here. With proper tracking in place, you can see exactly how your event impacted the deal cycle.
Bottom-of-the-funnel (BOFU) virtual event KPIs
In the BOFU stage, you have highly qualified leads that are ready to buy. They have done their research and decided to become your paying customers. Your event is just the icing on the cake to seal the deal.
Here are three BOFU stage KPIs that you can track for your events.
7. Attendee satisfaction: Did our event deliver on our promise?
🔍 Where to find: Survey platform
The best way to gauge how well your event was received? Send out a post-event survey. This can be sent in a follow-up email or in the event experience (for digital events) immediately after a session ends.
Your post-event survey can be as detailed or high-level as you make it. This can also be an opportunity to ask open-ended questions to solicit qualitative feedback.
While detailed surveys are helpful, especially for larger-scale events, getting a high volume of responses is tricky.
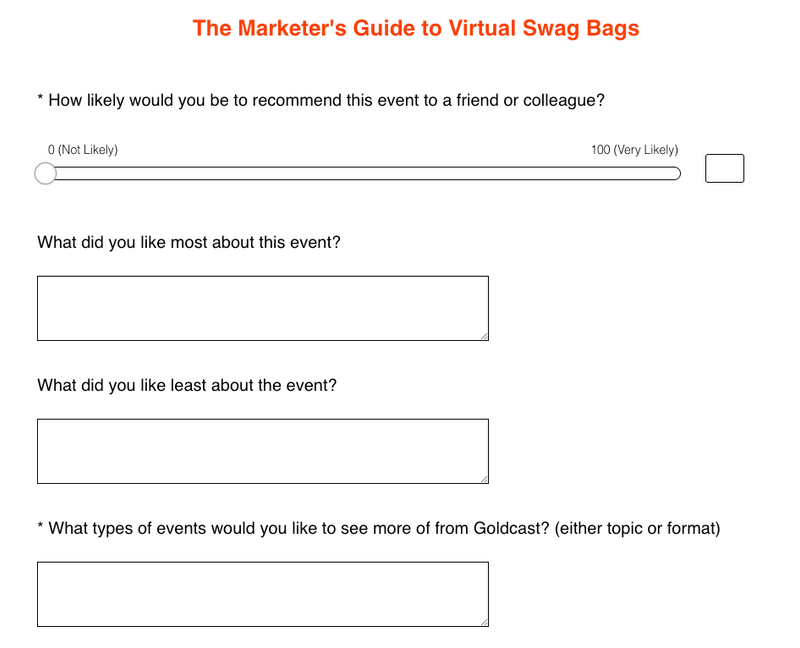
If you’re not as concerned with deep feedback, we recommend getting a pulse on the attendees by using the net promoter score (NPS). It’s a method specifically designed to measure customer loyalty and satisfaction.
For NPS, you typically ask a single question like, “On a scale of 0-10, how likely are you to recommend this virtual event to a friend or colleague?”
Depending on the score given, the respondents are divided into three categories:
- Detractors (Score 0 to 6) are the unhappy attendees. They didn’t like your event. You could spend time learning why they didn’t like the event and see how you can improve their experience next time.
- Passives (Score 7 and 8) are neutral. They are satisfied with the event but won’t go out of their way to talk about it.
- Promoters (Score 9 and 10) are the most satisfied and happiest attendees. This group is your tribe.
You calculate the NPS using the following formula:
NPS = % promoters - % detractors
Your NPS can range between -100 and 100. The higher the NPS, the more loyal the audience you have.
8. Revenue generated: Did our event drive revenue?
🔍 Where to find: CRM
The end goal for most B2B events? Revenue!
Educating, engaging, and inspiring your audience are all important, but when it comes to showcasing the value of digital events, revenue is the name of the game. Event marketers need to clearly demonstrate that their investments are generating a positive return either through new business, renewals, or expansions.

Syncing your digital event platform with your CRM is the best way to connect the dots between event activity and revenue activity. This connection will allow all event data to seamlessly flow into contacts and opportunities.
9. Return on investment: Was the event worth the investment?
🔍 Where to find: Event Budget + CRM
This is it—the big question that event teams are often asked: “What’s the ROI?”
Revenue is great, but without additional context, this number can be a vanity metric. What if the total cost of the event well exceeded the revenue you generate as a result?
Return on investment provides a more holistic view of event performance. It essentially tells you how much value you get in return for every $1 you spent on the experience.
Most marketers know this, but as a refresher, here’s how you can calculate the event ROI:
ROI = Total Revenue Generated / Total Event Cost
This KPI is relatively easy to calculate and is an easy metric to share with other teams that clearly demonstrates the impact of an event.
Blow your boss away with clear Event ROI
There you have it—nine metrics to help event organizers measure the success of virtual events.
From pre-event metrics like registrations all the way through to revenue generated post-event, a solid tech stack that connects the data dots is an event marketer’s best friend.
Not only does data help you showcase the value and impact of events, but it also arms your team with valuable information that can be used for personalized event follow-ups and planning your next event.
That’s a win in our books 💯

Transform Your Video Marketing with AI
Stay In Touch
Platform
Resources
Company
© 2026 Copyright Goldcast, Inc. All rights reserved.
YOUR PRIVACY CHOICES



 Upcoming Events
 Event Series
 On-Demand Events