


 Upcoming Events
 Event Series
 On-Demand Events
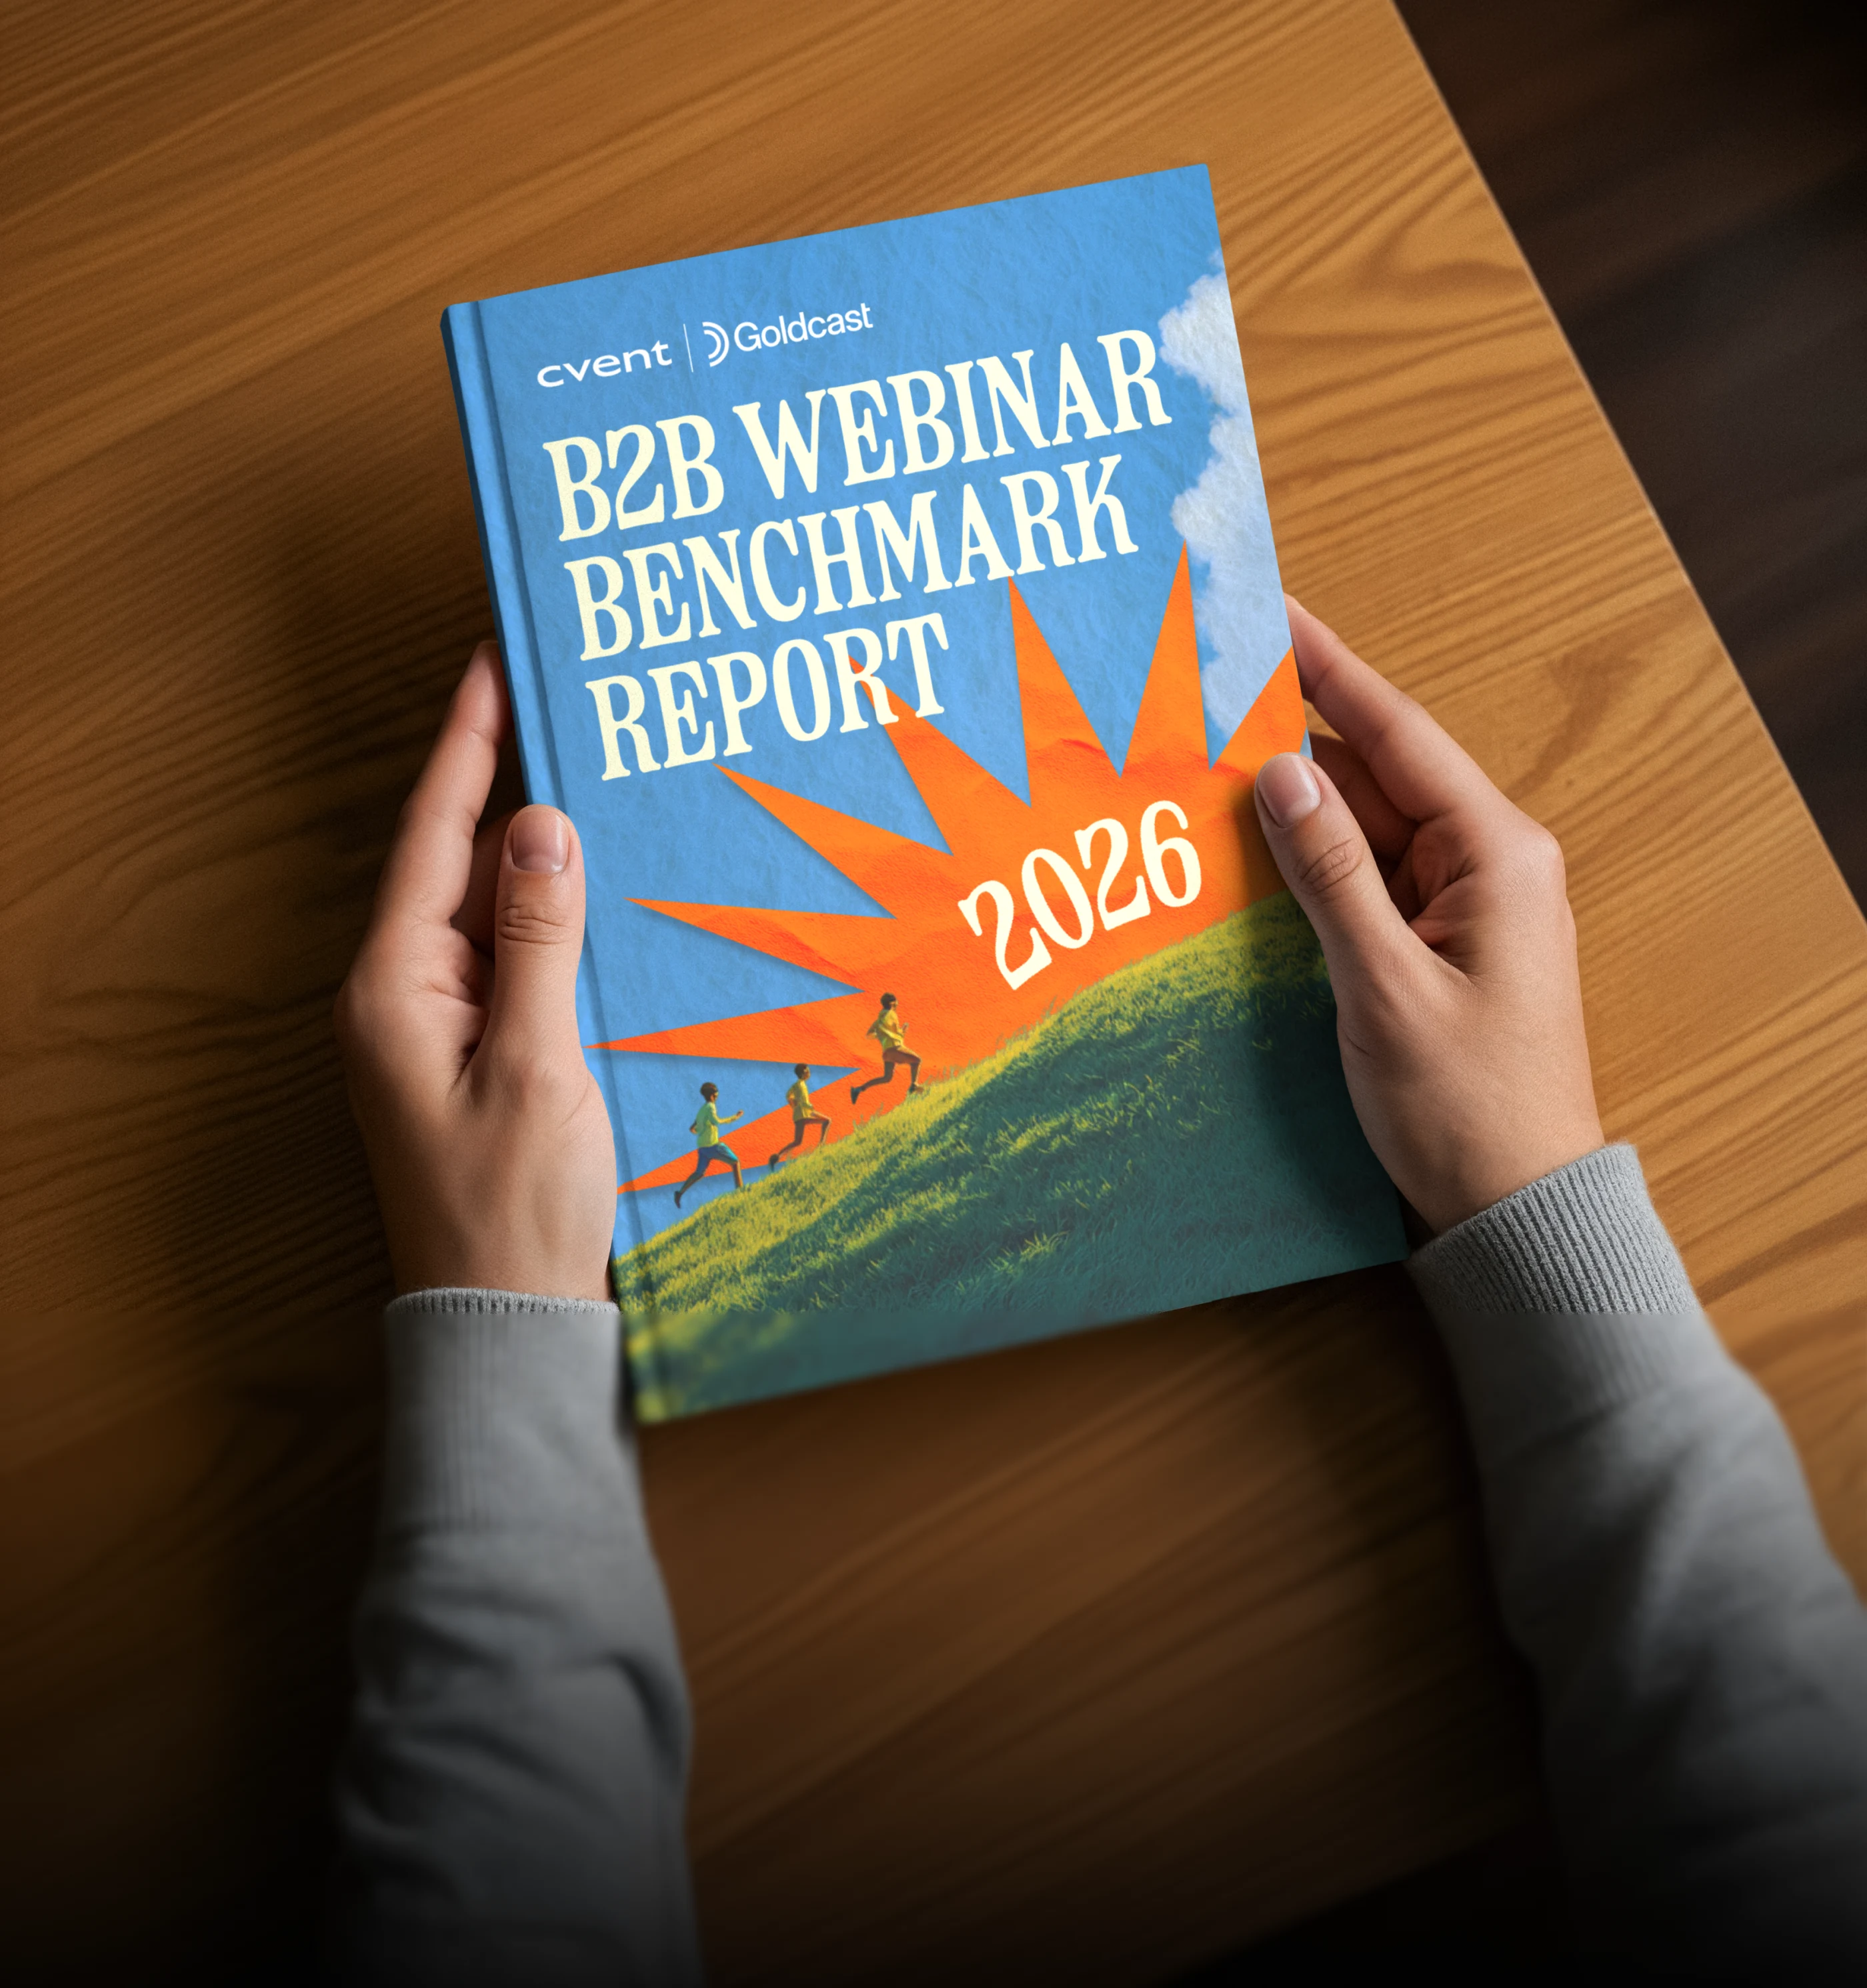


2026 B2B Webinar Benchmark Report
Powered by Goldcast
Table of Contents
- Foreword: A note from Goldcast CMO, Kelly Cheng
- About the Data
- What Counts as a Webinar
- Webinar Length and Short-Form Growth
- Webinar Frequency
- Registrants and Attendance
- Scheduling and Timing
- Speakers
- On-Demand
- Webinar Series
- Webinar Titles and Naming
- Engagement
- AI in Webinars
- Revenue Attribution
- Benchmark Scorecard
- Webinars of the Future
- Put it to Work with Goldcast
Foreword: A note from Goldcast CMO, Kelly Cheng
A year ago, I was in a room packed with CMOs, event, demand gen, and content marketers, all circling the same question: what was AI actually going to change about our work? The energy was equal parts excitement and dread. Most had at least experimented with AI, but nobody was 100% on what was real and what was hype.
Twelve months later, the data in this report is painting a clearer picture.
In 2025, our customers generated 365,253 video clips in Content Lab. 97.8% of them were made by AI. That's not an "AI is coming" stat. That's an "AI is embedded in our workflows" statistic.
Webinars are the same story. When I started at Goldcast, we had to make the case for why companies should put on webinars. Today, they're infrastructure: the way B2B teams build mindshare, qualify buyers, generate content, and keep pace with a content velocity that simply didn't exist three years ago.
This is the biggest benchmark report we've ever put together. 26,190 webinars across 522 B2B brands in 2025. We looked at attendance rates, speaker counts, on-demand viewing patterns, series performance, AI adoption, content repurposing volume, and CRM integration rates. By industry, by company size, by geography. Year over year.
That doesn't mean the current "answer” to the AI question is definitive. A lot of us are still figuring out what modern webinar programs should look like in an AI-native world. I know I am.
What this report does give you is an honest picture of what your peers are actually doing. When they're running events, and for how long. What formats are working. Where AI has taken hold, and where it hasn't yet.
Use this report as a benchmark, not a prescription. Your program will have its own shape, as it should. But if you're wondering whether you're ahead of the curve, behind it, or right in the middle of where most of the industry sits — that’s what we’ve always wanted this report to be.
I'd love to chat more about all things webinars and AI. Find me on LinkedIn and let me know what resonated for you.

About the Data
Every number in this report comes from what B2B organizations actually did in 2025.
We pulled the full dataset directly from the Goldcast platform: 26,190 webinars hosted by 522 B2B organizations between January 1 to December 31, 2025.
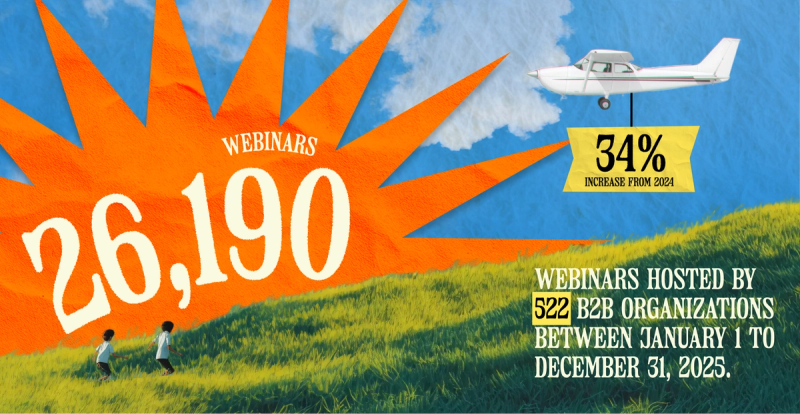
For context, last year's report covered 19,531 webinars across 418 brands. We're working with significantly more data this time around (a 34% and 25% increase, respectively). That means the benchmarks you'll find here are sharper and more reliable than ever.
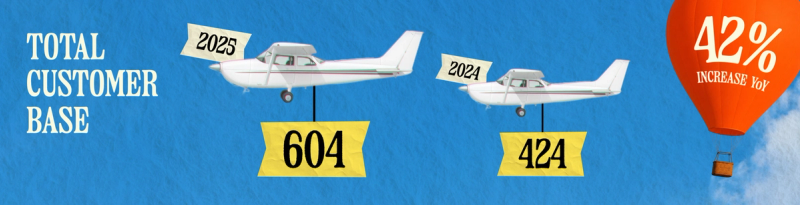
Our total customer base also grew from 424 organizations in 2024 to 604 in 2025, a 42% year-over-year (YoY) increase.
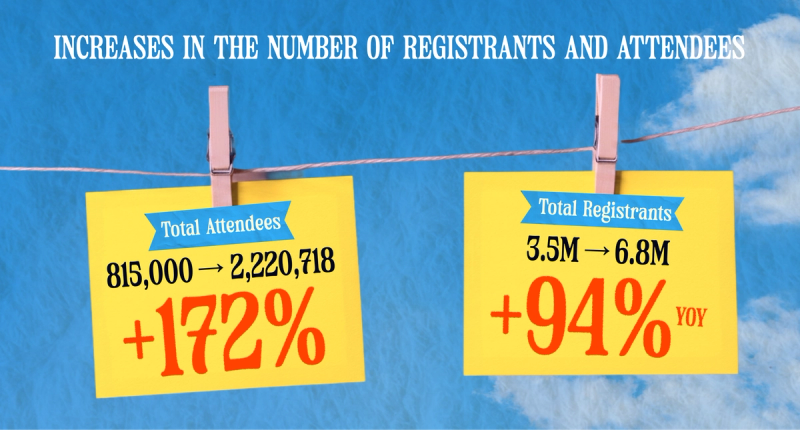
We continued to see big increases in the number of registrants and attendees:
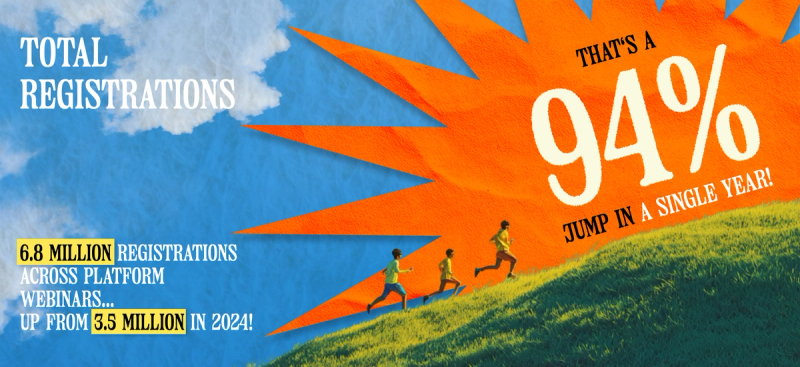
- Total registrants: 3.5M → 6.8M = +94% YoY
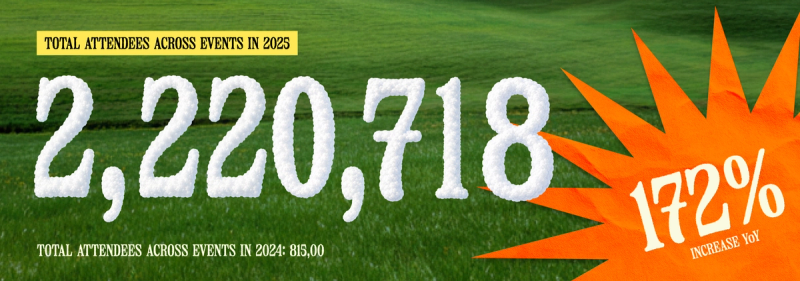
- Total attendees: 815,000→ 2,220,718 =+172%

In general, use this report as a mirror for your own program. The benchmarks here reflect real behavior from 522 organizations across industries, company sizes, and geographies. When you compare your numbers against ours, you're comparing against what's actually happening in the market.
As you read through each section, keep your own metrics close. Where you're above the benchmark, double down. Where you're below it, you'll find the data (and the guidance) to understand why.

What Counts as a Webinar
For the purposes of this report, a webinar is a single-session event, in contrast to multi-session virtual events like conferences, summits, and all-day workshops. The most effective webinars are short and focused, most run 60 minutes or less, but we count any qualifying single session regardless of length.
Each event instance counts once, whether it's a standalone session, a recurring series episode, or part of a larger program. We excluded test and template events, and we made sure not to count the series themselves as a webinar (since each individual episode is counted).
It's worth drawing a distinction that comes up often: webinars are not the same as virtual events. Virtual events can include multi-session conferences, all-day summits, extended workshops, and other formats that go well beyond the focused, single-session experience a webinar is built around. That distinction matters when you're benchmarking! The data in this report is webinar-specific, and that's intentional.
Webinar Formats
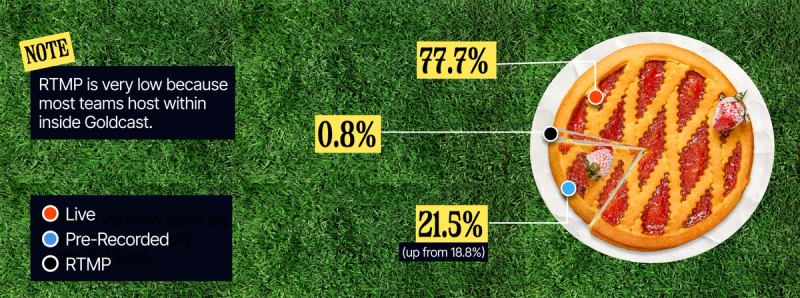
Not all webinars are built the same way, and understanding the format options is the first step toward building a program that actually fits your team and your audience. Goldcast supports three webinar formats: live, pre-recorded, and RTMP.
Live is exactly what it sounds like: You host your webinar in front of a real audience in real time. Pre-recorded means you record ahead of time and release on a schedule of your choosing, while still keeping polls, chat, and Q&A open during playback, so attendees can engage even without speakers present on the day. RTMP, or Real-Time Messaging Protocol, is for simulcasting to external platforms like LinkedIn or YouTube, which is useful when you want your event available on multiple channels simultaneously.
Live webinars are still the most popular format by a wide margin, and that's unlikely to change anytime soon. There's an energy to a live event that's hard to replicate. However, the shift toward pre-recorded events is real and worth paying attention to:
- Live: 77.7%
- Pre-recorded: 21.5% (up from 18.8%!)
- RTMP: 0.8% (Note: this is very low because most teams host fully inside Goldcast)
Pre-recorded is no longer a fringe choice. At 21.5%, it’s growing into a legitimate second format that teams across industries are using strategically.
Why pre-recorded is earning its place
Pre-recorded webinars work especially well in scenarios where consistency, compliance, or speaker availability are a concern.
If your thought leaders are stretched thin, pre-recording means they show up once and you get multiple runs out of the same session. Pre-recording is also well suited to regulated industries, where content often needs multiple rounds of approval before going live. It gives you that control without sacrificing the attendee experience. And if you're running the same event across multiple time zones, pre-recording lets you scale reach without scaling speaker fatigue.
If your webinar program is entirely live, it's worth asking whether pre-recorded could extend your reach without burdening your team. Think about the events you run repeatedly: product demos, onboarding sessions, training content, or thought leadership that doesn't change much from run to run. Those are natural candidates for pre-recording. You'll get a more consistent experience for attendees, more flexibility for speakers, and more opportunities to reach audiences across time zones without anyone having to set an alarm for 5 AM.
Webinar Length and Short-Form Growth
The 45-to-60 minute webinar has been the default for years, and in 2025, that held true. Around half of all webinars came in at exactly 60 minutes, and the median length held steady at 60 minutes for the second year in a row.
Average webinar duration dipped slightly, from 58.4 minutes in 2024 to 56.8 minutes in 2025. That’s a small but telling shift that reflects a broader pattern: teams are getting tighter, cutting the padding, and respecting their audience's time more than ever before.
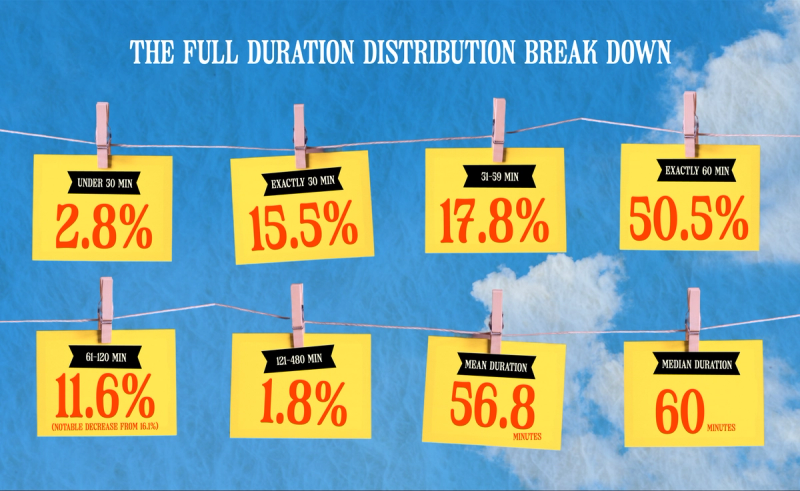
Here's how the full duration distribution broke down, with most numbers holding steady:
- Under 30 min: 2.8%
- Exactly 30 min: 15.5%
- 31-59 min: 17.8%
- Exactly 60 min: 50.5%
- 61-120 min: 11.6% (notable decrease from 16.1%)
- 121-480 min: 1.8%
- Mean duration: 56.8 min
- Median duration: 60 min
Take a look at the decrease that happened with webinars that are longer than one hour. People don’t want more padded, over-long sessions. This decrease represents the single biggest shift in the distribution! Audiences are actively voting against runtimes that drag, and marketers are listening.
The short-form shift is real, but it's happening in the 30-minute bucket
The 30-minute webinar is quietly becoming one of the most appealing formats in B2B. It rose from 13.2% to 15.5% of all events YoY and combined with the under-30-minute bucket, webinars running 30 minutes or less now make up more than 18% of all webinars.
The reason is simple: 30 minutes is the perfect comfort zone. It's short enough that attendees don't hesitate to block it on their calendar, but long enough to deliver a complete, substantive idea.
With back-to-back meetings being the norm and attention the scarcest resource in the room, a 30-minute commitment feels manageable in a way that an hour does not. For hosts, it also creates a useful creative constraint. When you only have 30 minutes, you're forced to be ruthless about what makes the cut, which tends to produce tighter, more focused content that audiences actually stay for.
Length varies meaningfully by industry
These overall benchmarks are useful, but they don't tell the full story. How long your webinar should be depends significantly on what industry you're in and what your audience expects from you.
In previous years, regulated industries like financial services and healthcare consistently ran longer than their non-regulated counterparts. In 2025, that gap has narrowed significantly. Finance, Healthcare, and Legal are running roughly the same average length as Technology and Software. (Jump to Section 7 for more info.)
The more useful lens now is audience expectation and topic complexity, rather than just regulatory status. A complex technical topic warrants more time, no matter what industry you’re in.
For most B2B webinars, 45-60 minutes remains the sweet spot. It’s long enough to deliver real value and short enough to fit into a busy workday.
If your webinars regularly run past the hour mark, audit the last 20 minutes. That's typically where engagement drops off and where the most trimming can happen without losing substance. And if you haven't experimented with a tighter 30-minute format yet, the data suggests your audience is ready for it; especially for focused, single-topic sessions where you want a lower time commitment barrier to entry.
Webinar Frequency
B2B teams are hosting more webinars, more often, and the numbers keep climbing.
In 2025, organizations hosting webinars on Goldcast averaged 4.7 webinars per month, or roughly 56 per year.
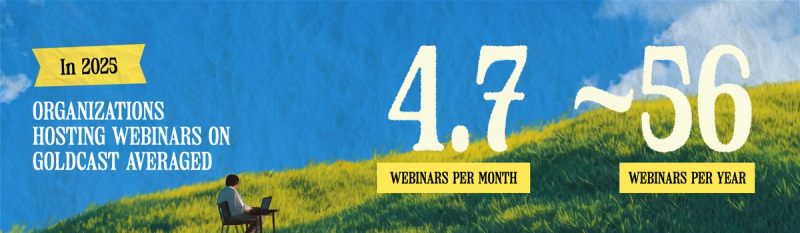
That's up from an average of 3.9 per month, or 47 per year in 2024, continuing a trajectory that shows no signs of slowing down. To put that growth in longer context: In 2021, companies were averaging just 1 webinar a month, or 13 webinars per year. In four years, that number has more than quadrupled.
Webinars have completed their transition from quarterly tentpole event to marketing must-have. The teams seeing the most success treat each webinar as a one-off production, building repeatable workflows, consistent formats, and content calendars that make showing up regularly feel manageable.
Several forces are driving this growth. Better measurement has made the ROI case easier to defend internally, so budget conversations are less of a battle. AI has decreased production costs significantly, making it possible to create more without increasing headcount or agency spend. End-to-end platforms have reduced the overhead of producing each individual event. And the use cases for webinars have expanded well beyond lead generation — sales teams use them to advance deals, product teams use them for feature reveals, and customer success teams use them for onboarding and education. When more teams inside a company are running webinars, the overall cadence goes up naturally.
If you're running fewer than four webinars a month, you may be under-investing relative to your peers.
That said, volume without quality is a fast track to audience fatigue, so remember that the goal is a scalable production workflow that lets you maintain quality as you ramp up quantity.
Take stock of which teams in your organization are currently running webinars, and which ones could be. Sales, product, and customer success are the most natural candidates beyond marketing. The more webinars become a shared company habit rather than a marketing department project, the easier it becomes to sustain the cadence your audience expects.
Registrants and Attendance
Webinars are accelerating at breakneck speed.
Take a look at these numbers:
Total registrations: 6.8 million registrations across platform webinars, up from 3.5 million in 2024
That's a 94% jump in a single year! This might be the clearest signal yet that B2B audiences are signing up for webinars in record numbers.
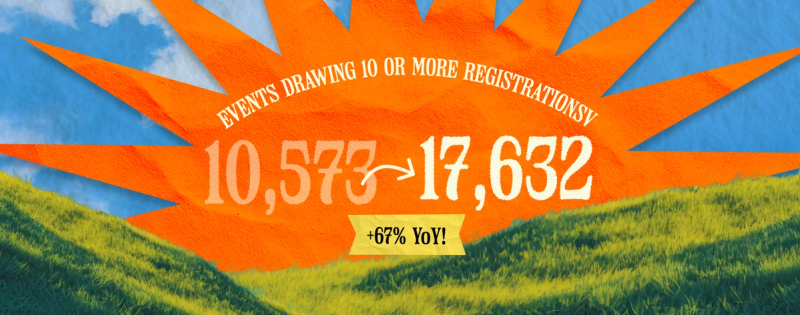
Events drawing 10 or more registrations: +67% YoY, from 10,573 to 17,632
More webinars across the platform are finding real audiences, not just a handful of headline events pulling the total up.
Average registrants per event: 251 in 2025, up from 238 in 2024
Even as the total number of events grew significantly, the average registrants per event increased, too. That means audiences aren't being spread thin across more events; they're showing up in greater numbers across the board.

Total attendees across events: 2,220,718
That's up from 815,000 in 2024 — a 172% increase year over year. Nearly triple. When you combine that with the 94% jump in registrations, it’s obvious that not only are more people signing up for webinars, significantly more are following through and actually attending.
Average attendees per event: 102, up from 51 — a 100% increase
Average attendees per event doubled year over year, which tells you that registration intent is converting into real attendance at a meaningfully higher rate.

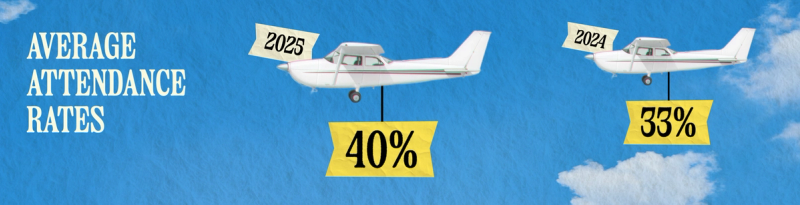
Attendance rates: 40%, up from 33% in 2024
What’s influencing higher attendance rates? Many teams have gotten smarter about promotion, more deliberate about scheduling, and more intentional about making sure the right people are receiving the right, personalized invitations.
We’ll dive into this more in Section 7, but many factors influence attendance: the day and time of the event, the relevance of the content, the reach of the speakers, the strength of the promo effort, and whether the event is part of a recognized series.
Custom-built registration pages: 98.7% of customers use these
Nearly all Goldcast customers now use a custom-built registration page rather than a standard template, turning what used to be a simple form into a branded moment that sets audience expectations before the event even begins.

Highest Registrants Award 2025
For the second year running, Capital Group's annual Outlook webinar takes the top spot. Their 2026 Outlook event drew 68,828 registrations — beating last year's record of more than 64,000.
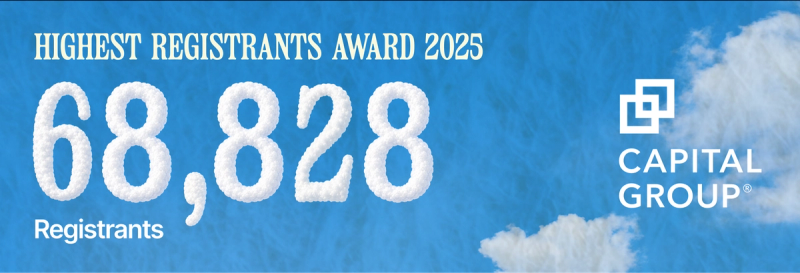
The reasons this event keeps performing are worth studying: It's part of an established series with a built-in repeat audience, it delivers timely and high-value market insight at exactly the moment people are looking for it, and the speaker panel brings decades of combined experience that gives every insight real weight.
Check your registration numbers against the 251 average and your attendance rate against the 40% benchmark.
If your registrations are strong but your attendance rate is lagging, the gap is usually in your pre-event communication. Are you sending enough reminders, and are they personalized enough to feel relevant to each invitee?
If your attendance rate is healthy but your registrations are low, the issue is likely reach: Who is seeing your event, and are you doing enough to put it in front of the right people?
Track both numbers over time, not just for individual events, and look for the patterns that tell you where your program has room to grow.
Scheduling and Timing
When you host your webinar matters tremendously. Timing affects how many people register, how many show up, and how engaged folks are when they log on. This year’s data gives us the clearest scheduling picture we’ve ever had, with a few surprising findings.
What days are most popular for webinars?
- Wednesday: 30.53% (up from 27.34% last year)
- Thursday: 30.03%
- Tuesday: 24.42%
- Friday: 7.44%
- Monday: 6.92%
- Weekend: under 1%
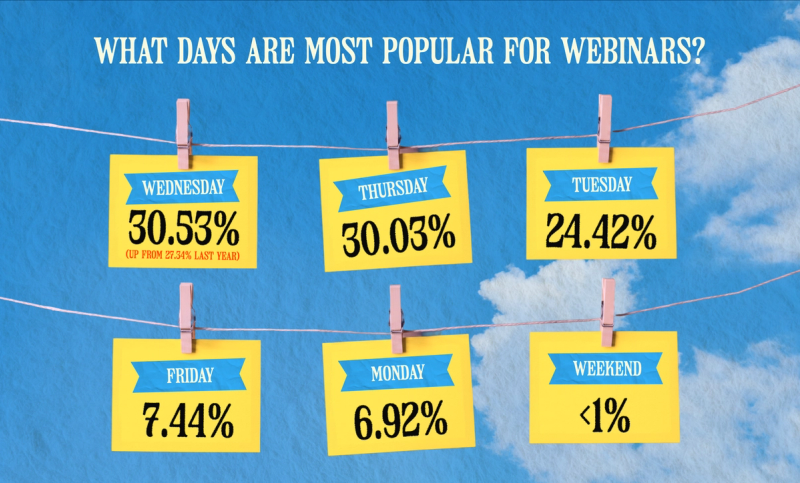
Wednesday is now the most popular day, whereas last year was Thursday (although they’re arguably equal in popularity right now).

The sustained mid-week dominance reflects how most B2B professionals actually work. Mondays are for planning and catching up. Fridays are increasingly protected from meetings. The middle of the week is where calendars open up and people have the bandwidth to actually show up and engage.
Scheduling volume and attendance rate tell different stories
While Wednesday and Thursday dominate scheduling volume, they don't dominate attendance rates. Here's how each day actually performed in 2025:
- Monday: 47.2% attendance rate, 106 avg registrants
- Friday: 46.9% attendance rate, 77 avg registrants
- Tuesday: 41.2% attendance rate, 294 avg registrants
- Wednesday: 39.0% attendance rate, 258 avg registrants
- Thursday: 38.7% attendance rate, 486 avg registrants
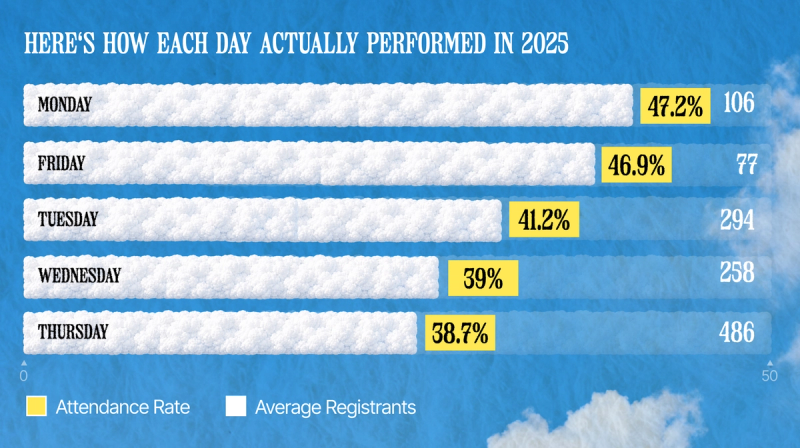
Monday and Friday convert best but draw the fewest registrants per event. Thursday draws the most registrants by a wide margin, but it also has the lowest attendance rate of any weekday. (It's worth noting that Thursday's average is significantly influenced by a small number of very large recurring events on the platform. The median Thursday event draws 80 registrants, which is a more typical benchmark for most programs.)
Tuesday remains the sweet spot for most teams: a strong 41.2% attendance rate with 294 average registrants, giving you both volume and conversion without the extreme tradeoffs of Monday or Thursday.
What time of day works best?
Peak hour: Noon ET
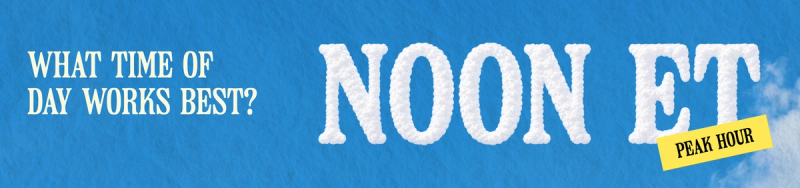
About 16% of all webinars started at noon ET, making it by far the busiest slot on the platform. It maps neatly to lunchtime on the US East Coast and late afternoon in Europe, hitting two major B2B audiences in a single time slot.
Tech vs. non-tech timing
Optimal timing varies meaningfully, depending on whether your audience skews technical or not.
Tech companies: Fri 2-5PM ET, 50.1% attendance rate
Non-tech companies: Fri 11AM-2PM ET, 47.7% attendance rate
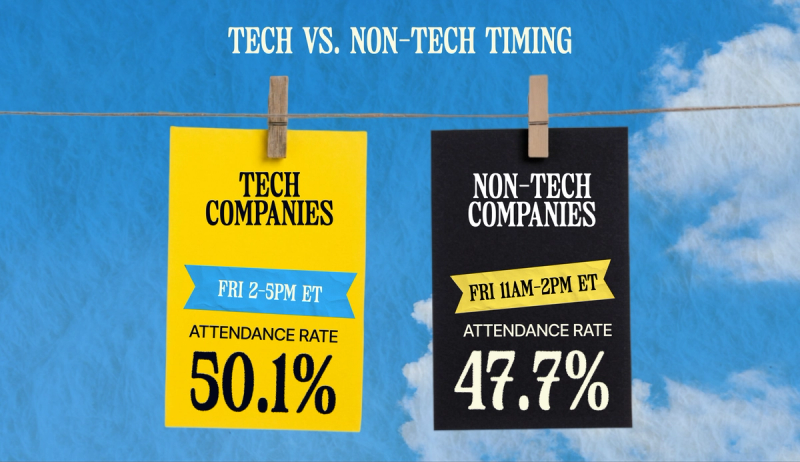
Both slots have shifted slightly later compared to last year (Tech moved from Fri 12-3PM ET; Non-Tech from Fri 9AM-Noon ET), and attendance rates have held strong. If you're looking for a high-conversion slot and your audience is primarily US-based, Friday afternoon is worth testing regardless of whether you're in tech or not.
Other Industry-specific timing
When we drill down by industry, the optimal day and time slot shifts further. Note that sample sizes per slot are on the smaller side, so treat these as signals to test rather than definitive rules:
- Manufacturing: Fri 11AM-2PM ET, 63% attendance rate
- Business Services: Mon 5AM-8AM ET*, 56.2% attendance
- Consulting: Tue 8AM-11AM ET, 46.9% attendance
- Media: Tue 11AM-2PM ET, 45.2% attendance
- Finance: Wed 11AM-2PM ET, 39.2% attendance
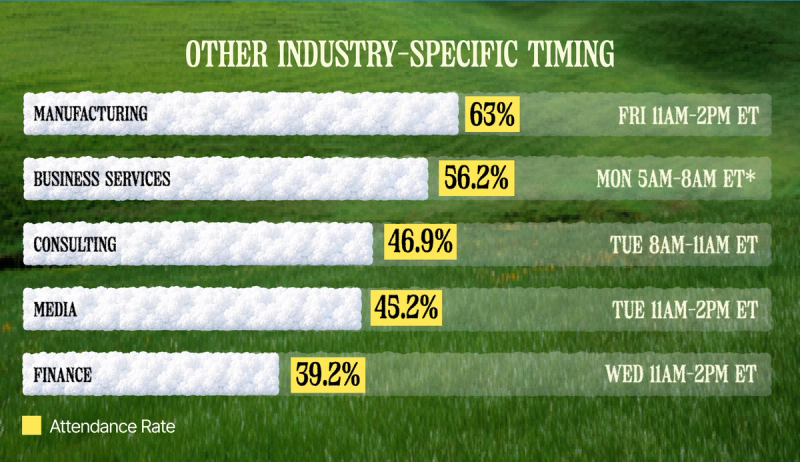
*The Business Services Monday 5AM-8AM ET slot likely reflects a concentration of global audience activity outside US business hours. If your Business Services audience is primarily North American, Tuesday or Wednesday morning ET slots are worth testing first.
Industry-specific webinar duration
How long your webinar should be depends significantly on what industry you're in. Here's how average duration broke down by industry in 2025, compared to 2024:
- Finance: 74 mins (down from 88 mins in 2024)
- Technology: 77.4 mins (down from 79 mins in 2024)
- Consulting: 69.4 mins (up from 63 mins in 2024)
- Manufacturing: 68 mins (up from 63 mins in 2024)
- Healthcare: 76.3 mins (up from 61 mins in 2024)
- Business Services: 64 mins (up from 57 mins in 2024)
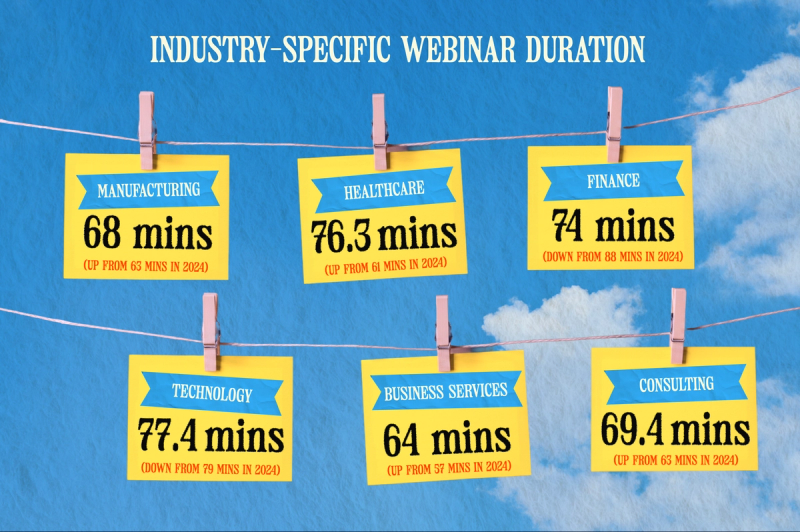
This year's data shows a more level playing field between regulated and non-regulated industries in terms of duration. Finance and Technology, for example, now run at nearly identical lengths. That’s an indication that the industry matters less than the topical content; if you’re presenting a dense topic, use more time, regardless of the industry you’re in.
The 12PM ET peak hour tells you where the crowd usually is. Schedule there for maximum registrations or deliberately avoid it if you want less competition.
For attendance rate, Tuesday is your most reliable all-around bet: strong conversion, solid registration volume, and none of the extreme skew you see on Monday or Thursday. If you want to experiment with a high-conversion slot, Friday afternoon is showing strong results across both tech and non-tech audiences this year.
If you're in a specific industry, use the timing cuts above as a starting point — but remember that the sample sizes are small, so the real value is in testing them against your own audience. Run the same event at two different times, compare the attendance rates, and let your data tell you what works for your program specifically.
Speakers
The solo-presenter webinar is quietly becoming the exception rather than the rule. In 2025, the average webinar featured 3 to 4 speakers. This is consistent with what we saw last year. Webinars have become conversations more than lectures, and audiences have come to expect the texture and energy that comes from multiple voices in the room.
Average speakers per webinar in 2025: 3-4

The benefits of having multiple speakers compound quickly. Spreading the speaking load reduces presenter fatigue and keeps the energy up throughout the event. Approaching a complex topic from multiple angles drives richer discussion and gives attendees more to engage with. And when a webinar feels like a real conversation rather than a one-way presentation, people lean in, which shows up directly in your engagement metrics.
There's a promotional upside, too. Every speaker you add to your panel is a potential amplifier for your event. When speakers share the event with their own networks, your reach multiplies without any additional effort on your end. Be sure to give them the tools to succeed! Branded promotional assets, pre-written social copy, and a clear ask go a long way.
Capital Group's record-breaking 2026 Outlook webinar is a solid example of the multi-speaker model working at scale. Three speakers brought a combined 80+ years of industry experience to the session, and the result was an event that drew nearly 69,000 registrants and kept audiences engaged throughout.
If you're still defaulting to a single-speaker format, it's worth rethinking that approach. Start by identifying one or two thought leaders, inside your organization or out, who could add a distinct perspective to your next webinar.
External voices, whether customers, partners, or industry analysts, are particularly valuable because they bring credibility that's independent of your brand. Once your panel is set, make promotion easy. Give every speaker branded assets and pre-written copy so they can easily share the event. The more speakers you have invested in the event's success, the wider your reach before a single attendee even registers.
On-Demand
The live session is just the first showing. On-demand is where your reach compounds. Global audiences in multiple time zones can’t all make the live session. Busy buyers want to watch on their own schedule. Marketers want to get more value out of every event than a single broadcast can deliver. And Content Lab has made it easier than ever to clip, repurpose, and redistribute on-demand recordings after the fact.
On-demand availability is now effectively universal.
On-demand availability: 89.1%

89.1% of webinars were made available after the live event ended, up from 79.86% in 2024. That nearly 10-point jump in a single year tells you that teams have stopped thinking of their webinars as one-time broadcasts and started viewing them as content assets with a long shelf life.
On-demand viewership
On-demand viewers make up 15.9% of total viewership, which is a meaningful slice of your total audience that never would have been reached through the live session alone. Here's how that breaks down:
- Average on-demand views across all events: 14
- Percentage of on-demand events that receive at least 1 view: 67.3%
- Average on-demand views for events with at least 1 view: 20.8
- Percentage of live attendees who later watched the on-demand replay: 10.61%
- Percentage of registrants who only watched on-demand and never attended live: 2.62%
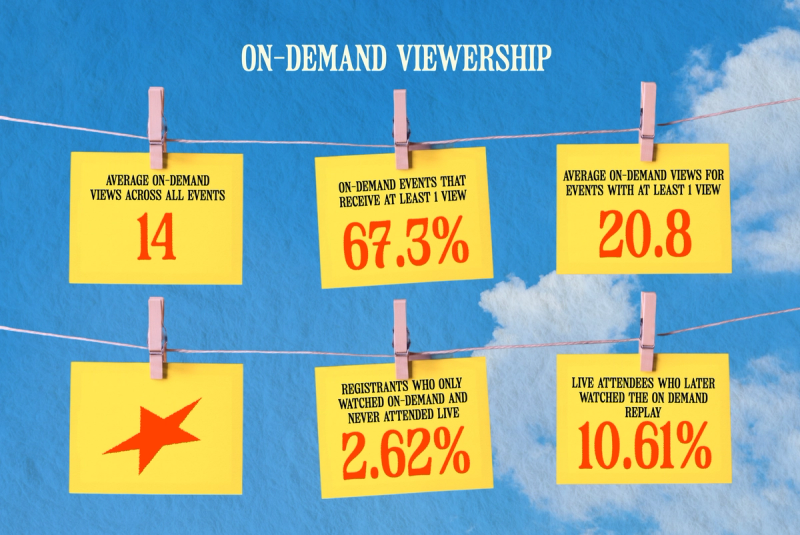
The 14 overall average includes events that received zero on-demand views. However, among the 67.3% of on-demand events that do receive on-demand views, the average is 20.8. This is consistent with last year’s average of 21.
More than 1 in 10 live attendees came back to watch the recording afterward: reviewing key moments, catching up on what they missed, or sharing it with colleagues. And 2.62% of registrants skipped the live event entirely and went straight to on-demand. Your webinar audience extends well beyond the people in the room on the day, and it keeps growing after the event ends.
Treat these returning viewers as high-intent leads, not passive replays. Someone who comes back on their own time to rewatch your content is signaling interest worth a dedicated follow-up, not a generic post-event email.
On-demand video completion
For the first time, we can measure how much of a webinar on-demand viewers actually watch. Spoiler alert: They watch nearly all of it.
- Average on-demand completion rate: 91%
- Average live attendee completion rate: 74%
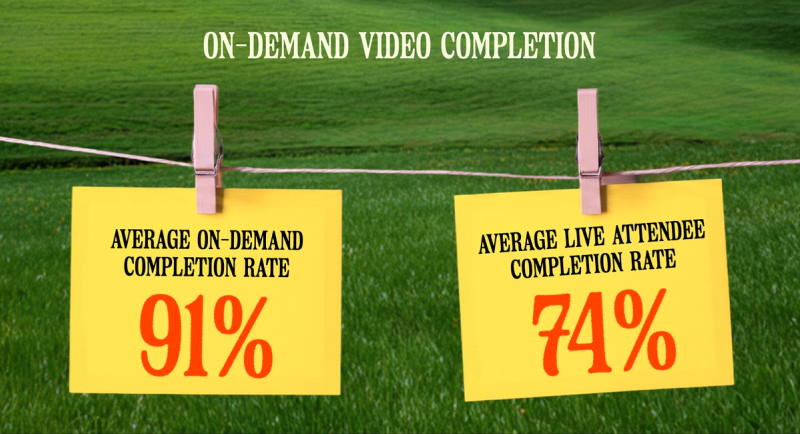
On-demand viewers are your most intentional audience. They carve out time specifically to watch your content with no distractions, no back-to-back meetings pulling them away and the completion numbers show it. Nearly every on-demand viewer watches the entire recording.
Live attendees, by contrast, average around 74% completion. Life happens during live events, and people step away, rejoin, and get pulled into other obligations. But it does mean that roughly a quarter of your live audience misses the end of your webinar. If your strongest CTA or most memorable moment lives in the final 10 minutes, a significant portion of your audience never sees it.
If you're not already making your webinars available on demand, start now. But the bigger opportunity is in how you treat the audience that shows up there.
A 91% average completion rate is a clear signal about intent. These are people who went out of their way to find your content and watch nearly all of it. That's a very different level of engagement than the average live attendee, and it deserves a very different follow-up.
Your on-demand viewers are some of your stickiest leads. They're self-selected, highly motivated, and already deep in your content. If you're sending them the same generic post-event email you send everyone else, you're leaving pipeline on the table.
Build a separate nurture track specifically for on-demand viewers. It should be one that acknowledges what they watched, points them toward related content, and moves them toward a next step that matches where they clearly already are in their journey.
One more thing to keep in mind: Live attendees complete about 74% of your webinar on average, which means roughly a quarter of your live audience drops before the end. Don't save your best material for last! Front-load your key insights and make sure your CTA lands in the first two-thirds of your event where nearly everyone is still with you.
Webinar Series
Nearly one in three webinars is now part of a series.
Series penetration has continued its steady climb in 2025, growing from 26% to 31.2% of all webinars on the platform. The companies driving this shift have discovered something important: A single webinar can generate a lead, but a series builds a relationship.
Series penetration: 31.2% of all webinars (up from 26% last year)

Episodes per series: 4 (median), with an average of 6.7 lifted by a handful of long-running series

When someone registers for a series, they're opting into an ongoing relationship with your brand.
Series audiences are looking for consistency. They want to know that you're going to show up regularly with something worth their time. They're looking for the kind of depth that only comes from returning to a topic across multiple sessions, rather than trying to cover everything in 60 minutes.
And they're looking for community. When the same group of people show up episode after episode, something shifts. The chat feels more familiar. The Q&A goes deeper. People start to feel like they're part of something, not just consuming it.
That's why series audiences are stickier than standalone audiences. They've made a repeated choice to come back, which means your brand is already building Mindshare between episodes. Every time they see your next event on their calendar, you're top of mind, which is exactly where you want to be in a B2B buying cycle that can stretch over months or even years.
There's a compounding content benefit for you, too. Every episode of a series generates another hour of raw material for your content pipeline via clips, social posts, email segments, blog drafts, and more. Unlike a standalone webinar where repurposing is a one-time exercise, a series gives you a reliable, recurring source of content that grows with every episode. The format and rhythm are already built, which means your team isn't starting from scratch each time.
The naming data backs this up
Webinars that include the word "series" in the event title earn higher attendance rates than those that don't, and that finding holds consistently across the dataset.
Webinars with "series" in the title:
- Average attendance rate: 42.1%
Overall benchmark:
- Average attendance rate: 40.1%
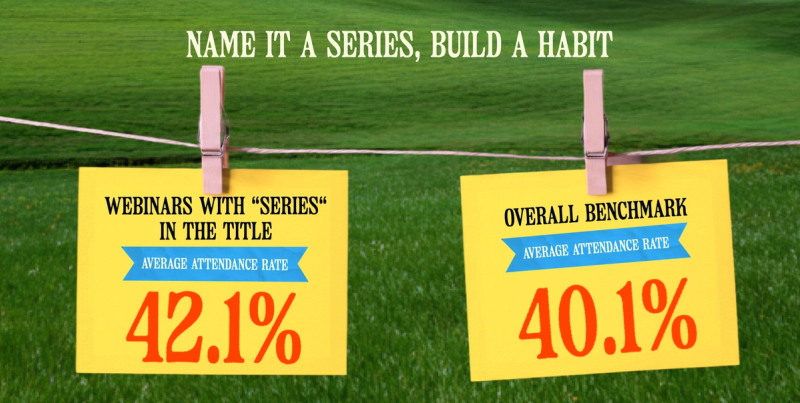
When audiences know they're signing up for an ongoing program, they're more likely to show up, not just once, but repeatedly. That's the compounding effect series are built on.
If you're not running at least one recurring series, this is the single biggest structural change you can make to your webinar program. The barrier to entry is lower than it seems: Pick a topic your audience cares deeply about, choose a cadence you can sustain, and commit to at least four episodes, the median length of a series on our platform in 2025. Nearly one in three webinars is now part of a series, which means your audience is already conditioned to look for and engage with serialized content. The question is whether yours is showing up in that mix.
Once you've committed to a series, be transparent about it. Put the word "series" in your title. Make it clear in your promotional copy that this is an ongoing program. Audiences who are looking for that kind of consistent, trusted content will self-select in and keep coming back.
Webinar Titles and Naming
What you call your webinar matters more than you might think.
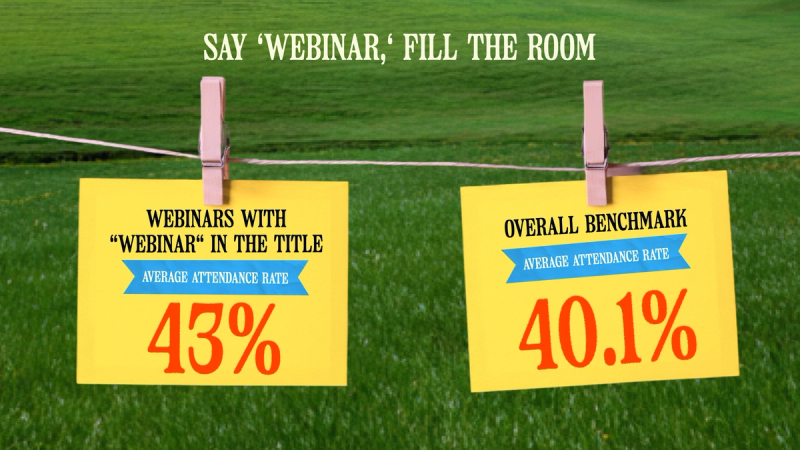
The data on this has been consistent for two years running. Webinars that include the word "webinar" in the title continue to outperform those that don't.
Webinars with "webinar" in the title:
- Average attendance rate: 43%
Overall benchmark:
- Average attendance rate: 40.1%
Yet the share of webinars using the word is still small, which means most teams haven't acted on this insight yet.
Share of webinars with "webinar" in the title: 5.6%

Why does the word "webinar" work?
A few years ago, the conventional wisdom was to avoid the word entirely. "Webinar" had become synonymous with dull, one-way presentations on generic meeting platforms, and marketers were advised to give their events more creative, aspirational names to draw people in.
That advice no longer applies. The webinar experience has been completely reinvented. Today's webinars are interactive, polished, and genuinely engaging. When someone sees the word "webinar" in a title now, it signals a known, structured experience with a clear time commitment and a specific topic. It's become a quality signal rather than a warning label, and attendance numbers reflect that shift.
If you haven’t reviewed the previous section, we recommend skimming the “Put it to work” on series. Two of the easiest wins in your entire webinar program live right here:
- If your next event is a webinar, call it a webinar.
- If it's part of a series, call it a series.
You don't need to overhaul your content strategy or your production workflow either. Just be transparent and specific in how you name your events. The audiences who are looking for exactly what you're offering will find it faster, and the data says they'll show up in greater numbers when they do.
Engagement
Engagement tells you whether an event was worth everyone’s time.
When attendees are active in the chat, asking questions, clicking on resources, and responding to polls, they're doing more than participating. They're signaling intent. Every question asked, resource downloaded, and poll answered is a data point your sales team can act on.
This year's engagement data is unambiguous: adoption is up across every single feature we track. More teams are turning on chat, Q&A, polls, resources, and CTAs, and audiences are using them. Engagement is no longer a nice-to-have, it is becoming standard practice.
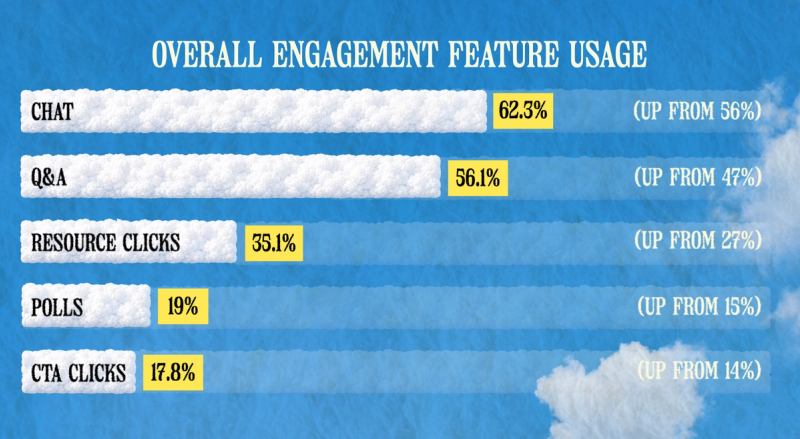
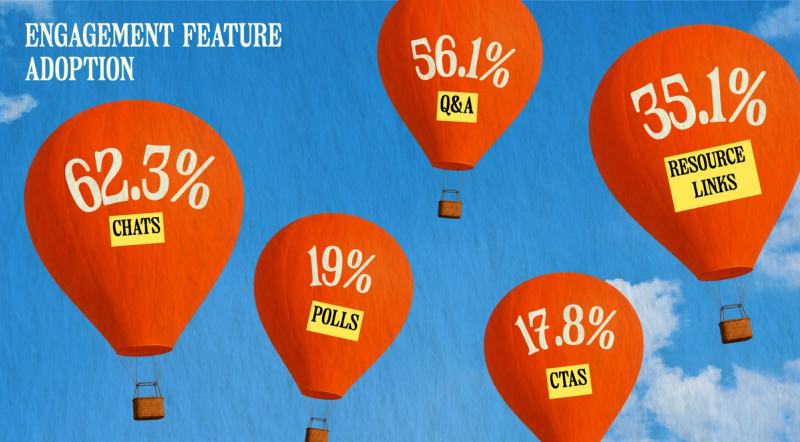
Overall engagement feature usage:
- Chat: 62.3% (up from 56%)
- Q&A: 56.1% (up from 47%)
- Resource clicks: 35.1% (up from 27%)
- Polls: 19% (up from 15%)
- CTA clicks: 17.8% (up from 14%)
Resource clicks are a pipeline signal you shouldn't ignore
The rise in resource clicks — from 27% to 35.1% of webinars — deserves special attention.
When someone clicks a resource during your webinar, they're self-directing their learning. They are going deeper on something that caught their attention without being prompted. That's a fundamentally different signal than a CTA click, and it maps directly to pipeline potential.
If you're not already tracking which attendees are clicking which resources and passing that data to your sales team, you're leaving real intent signals on the table. Someone who watched your webinar and clicked through five resources requires a very different conversation than someone who simply attended.
CTA clicks are growing in adoption but flat in depth
CTA usage grew from 14% to 17.8% of webinars; more teams are adding them, which is the right direction. The opportunity here is in the quality of the ask. A CTA that's specific, timely, and directly relevant to what was just discussed will outperform a generic "book a demo" button every time.
Polls remain underused
Polls are still only present in 19% of webinars. If you're in the 81% not using them, that gap represents a straightforward win. A well-timed poll breaks up the flow of a presentation, gives attendees an active role in the conversation, and generates real-time data you can reference during the event and repurpose afterward.
Engagement metrics are your most direct window into buyer intent, but only if you're treating it that way. Here's what the data tells us to do:
- Use chat and Q&A. Seed questions in the chat before the event starts, have a moderator keep the conversation moving, and make sure someone is monitoring and responding to Q&A in real time. These are your highest-usage features for a reason.
- Make resource links a deliberate strategy. Active in 35.1% of webinars and growing, resource links are your highest-adoption engagement feature outside of chat and Q&A. When attendees click, they're telling you exactly what they're interested in. Curate links intentionally: Every resource you offer should connect to where an attendee might want to go next. Track who clicks what, and route that data to your sales team.
- Add at least one poll to everywebinar. Poll adoption grew from 15% to 19% of webinars year over year, yet they're still the most underused feature in the engagement toolkit. If you're not using them, you're leaving one of the easiest engagement wins on the table.
- Build CTAs with intent. Adoption grew from 14% to 17.8% of webinars; more teams are adding them, which is the right direction. The next step is quality: A CTA that's specific, timely, and directly relevant to what was just discussed will outperform a generic ask every time.
Finally, pipe all of it — resource clicks, CTA interactions, poll responses, questions asked — into your CRM and scoring model. Attendees who engage heavily during a webinar are further down the funnel than a simple "attended" flag would suggest, and your pipeline will benefit from recognizing that.
AI in Webinars
AI usage exploded this year: from event branding to content planning, but mostly in post-event content production.
A year ago, AI was something most B2B marketing teams were experimenting with. Today, it's the default production method for anyone running a serious webinar program. The shift from experimental to infrastructure happened faster than almost anyone predicted.
For those who don't know, Content Lab is Goldcast's AI-powered repurposing tool that turns your video library (webinars, events, recordings) into clips, social posts, blogs, emails, and more in minutes rather than weeks.
Total video clips generated in Content Lab in 2025: 365,253
Of those, how many were AI-generated: 357,364, or 97.8%
Manually created clips: 7,889, or just 2.2%
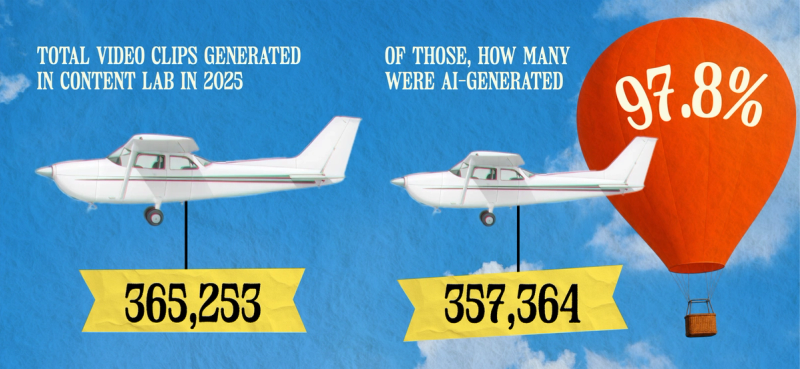

Manual clip creation has become the exception, and the 97.8% AI generation rate is the clearest evidence of how completely the landscape has shifted.
Content Lab adoption: 76% increase from last year
AI Search adoption: 94% increase from last year
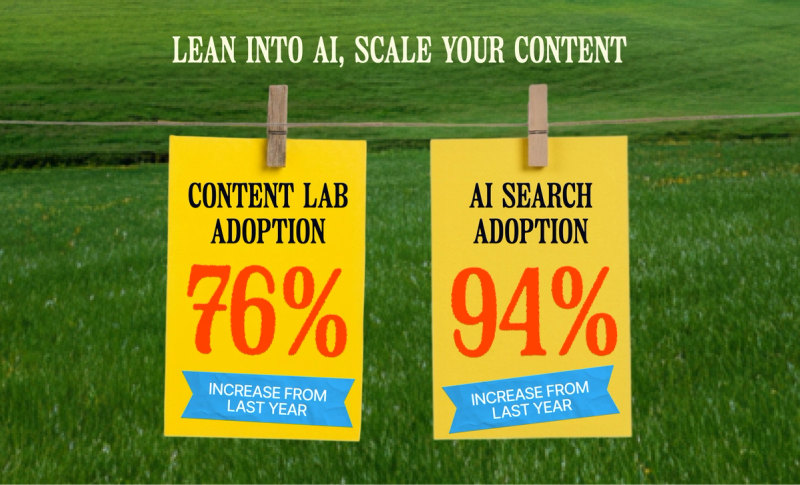
That growth reflects a fundamental change in how teams think about post-event production. Teams aren't just trying AI once. They're coming back, running more content through it, and building it into their standard post-event workflow.
When AI consistently produces clips, social posts, and email drafts good enough to publish with minimal editing, it becomes a core part of how the team operates.
What's driving AI adoption
The single biggest adoption driver is time. Before AI, repurposing a one-hour webinar meant rewatching the recording, manually identifying the best moments, transcribing key quotes, and writing downstream content from scratch. All in all, the process could consume an entire day.
With tools like Content Lab, the same work takes minutes, and the output arrives polished and ready to edit.
That time savings compounds quickly. Teams that used to produce one or two pieces of repurposed content per webinar are now producing dozens. Every session becomes a source of clips for social, drafts for email sequences, summaries for blog posts, and highlight reels for future event promotion.
Thanks to AI tools, each webinar generates content that keeps working long after the live event ends, extending its lifespan across channels and audiences that the original broadcast never reached.
The other driver is quality and the trust that comes with it. Early AI adopters often wondered whether the output would sound human, whether the AI would pick the right moments, and whether it would hold up to their standards. The 97.8% AI-generation rate answers that question.
Teams have tested the output, measured it against their benchmarks, and made the call that manual creation is not worth the time. That's a fundamental change in how B2B marketing teams operate, and it's happening across the industry right now.
If you're still manually clipping, captioning, or repurposing webinar content, the gap between your workflow and your peers' is growing every month.
Start with Content Lab's forever free version, which lets you upload one hour of content per month. Run your next webinar through it, see what comes out, and measure the time you save.

The Webinar Content Ecosystem
Not long ago, a webinar ended with the live session. The recording might get uploaded somewhere and maybe a follow-up email went out, but then the team moved on to planning the next one.
That model is essentially gone.
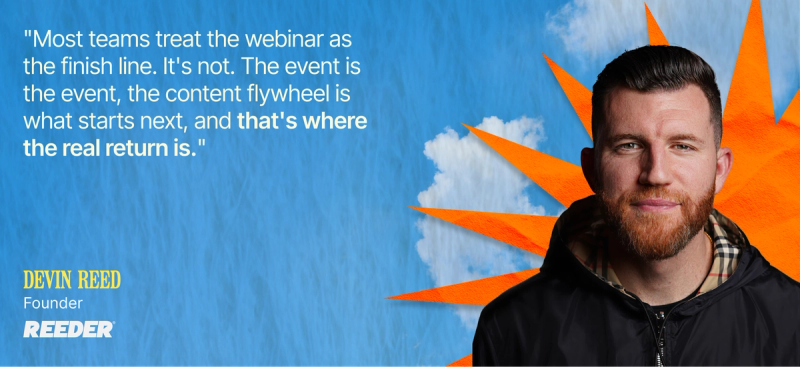
Now, the webinar is the starting point, not the finish line. One 60-minute session seeds a content pipeline that can run for weeks: video clips for social, email drafts for nurture sequences, blog post summaries for organic search, highlight reels to promote the next event, and sales enablement snippets for the team working deals.
Total clip volume: 365,253 clips, +173% YoY

Total unique text assets created: 231,538 (a 144.5% increase)
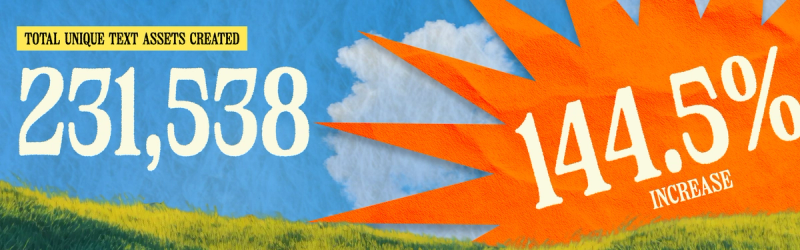
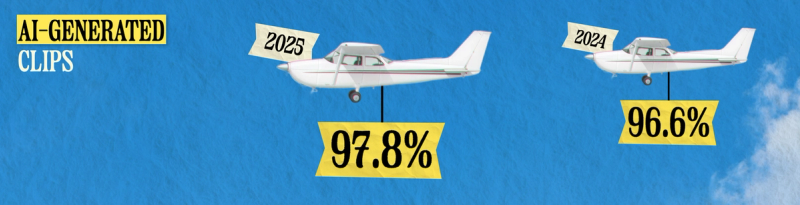
AI-generated clips: 97.8% of all clips AI-generated, up from 96.6% in 2024
The volume growth is significant, but the format shift happening underneath it tells an equally important story. In 2024, the Default layout dominated clip creation at 85.7% of all clips. In 2025, that share dropped to 62.2% and other formats grew dramatically.
Clip format breakdown:
- Default: 62.2%, down from 85.7%
- Audiogram: 30.8% — up 671% in volume YoY!
- Grid: 2.2%, +602% in volume
- Speaker: 1.8%, +249% in volume
- Focus: 153 clips
- PIP: 5 clips
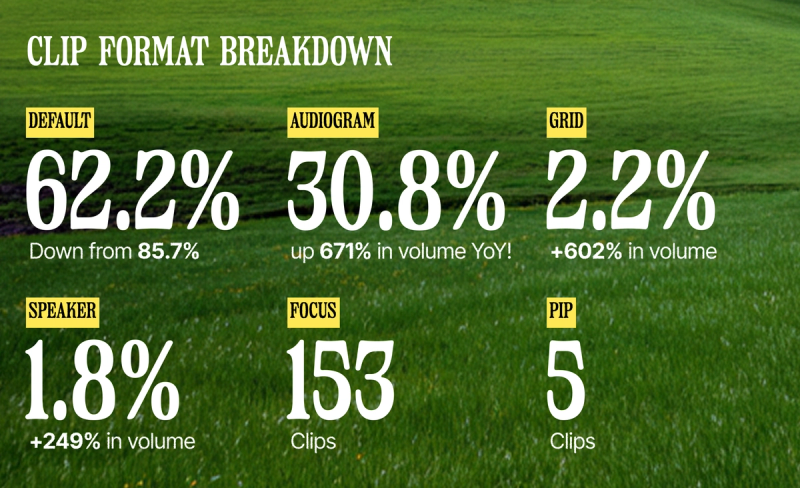
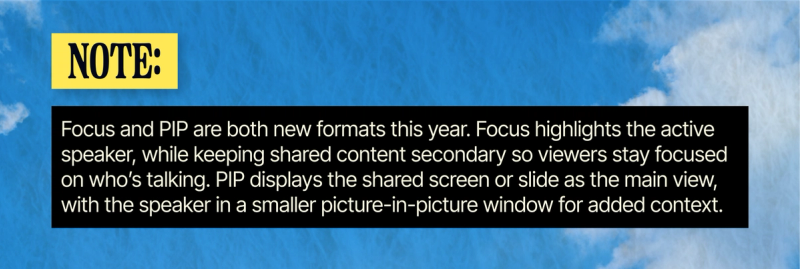
The Audiogram jump is incredible. Growing from 10.9% to 30.8% of all clips — a 671% increase in raw volume — signals that teams are increasingly packaging webinar content for audio-first and mobile audiences.
Audiograms travel well on LinkedIn and other social platforms, they work without sound, and they give a professional polish to what would otherwise be a raw video clip. The fact that this format nearly tripled its share in a single year suggests teams have figured out that not every piece of repurposed content needs to be a full video clip to be effective.
The asset mix has shifted too
In previous years, blog posts dominated what teams were creating from their webinar content. By 2024, the pattern had already tilted toward personalized emails and social posts. This makes sense because your audience spends far more time in their inbox and on LinkedIn than they do on your blog.
In 2025, that continued, with all asset types staying relatively stable.
Asset type distribution:
- Social posts: 37.9%
- Emails: 35.9%
- Blogs: 13%
- Takeaways: 13%
- Custom: 0.2%
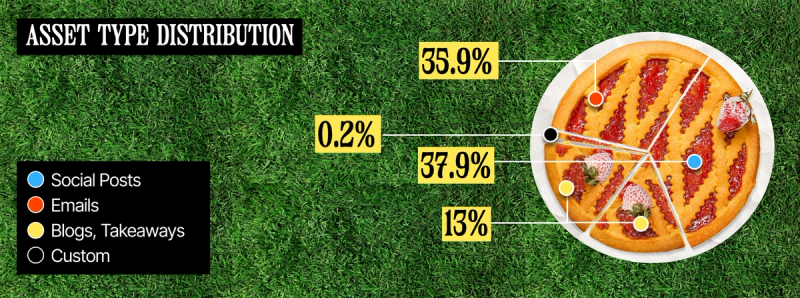
Email and social remain where B2B audiences actually spend their attention, and teams are meeting them there. This year, social posts took #1 (compared to last year’s report, where they were second to email), suggesting teams are getting more precise about which social channels they're optimizing for.
If your webinar program ends with the live session, you're extracting a mere fraction of the value available to you.
Map out what a full content ecosystem looks like for your next webinar before your next event. A single session run through Content Lab can produce the following:
- Clips ready for LinkedIn and Instagram
- A draft blog post summarizing key takeaways
- Email copy for both attendee follow-up and no-show re-engagement
- Social copy for speakers to share with their networks
- Highlight reels to drive registration for the next event
The best part? None of that requires starting from a blank page. The webinar transcript and recording are the inputs, and Content Lab handles the transformation.
Decide in advance which clips you'll pull, which email sequences you'll build, and which social posts you'll schedule. When you treat repurposing as part of the event production process rather than an afterthought, the output compounds. Teams that have built this workflow into their standard post-event process are building a library of evergreen assets that continues to drive traffic, engagement, and pipeline long after the live event date has passed. One webinar, planned with repurposing in mind, can fuel your content calendar for an entire quarter.
Revenue Attribution
Webinars have always been a marketing channel. In 2025, they're wired directly into the revenue stack, as proven by our integration data. The clearest signal of this shift is how many Goldcast customers have active CRM and marketing automation platform connections running against their webinar programs.
When a prospect attends a webinar, asks three questions, clicks two resources, and follows up on a CTA, that behavior doesn't stay inside the webinar platform. It flows directly into the CRM, triggers scoring rules, surfaces in sales workflows, and feeds attribution models. The infrastructure is in place. The question now is how effectively teams are using it.
Integration adoption:
- HubSpot: ~50% of customers
- Marketo: ~28%
- Salesforce: ~24%
- Activity Webhooks: ~21%
- Other integrations: Slack, Slack + Salesforce, Pardot, Wistia, Eloqua
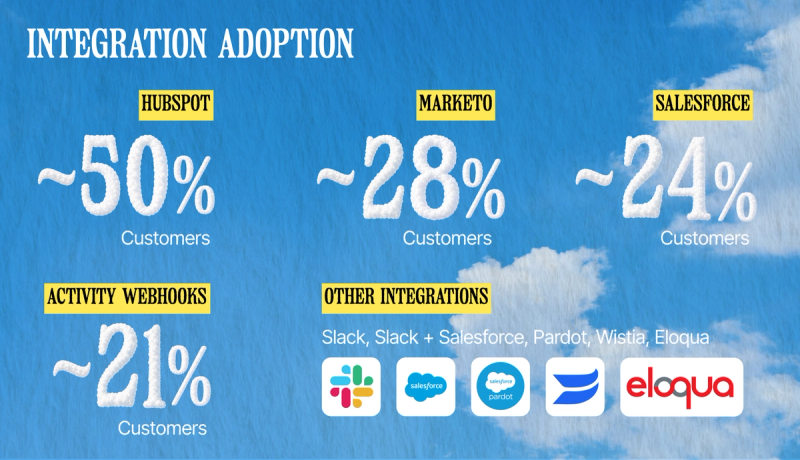
Half of all Goldcast customers have HubSpot connected, almost a third have Marketo, and nearly a quarter have Salesforce.
When these connections are live, sales teams can see exactly who attended, what they engaged with, how long they stayed, which resources they downloaded, and whether they clicked a CTA. That's a complete behavioral profile of a prospect, delivered automatically, without anyone having to manually pull a report.
The attribution loop in practice
The teams getting the most revenue impact from their webinar programs have closed the loop between event behavior and sales action. An attendee registers, shows up, engages heavily, and clicks through to a demo request. Within minutes, that lead is scored, routed to the right rep, and sitting in a follow-up sequence personalized to what they actually did during the event. The webinar didn't just generate a lead; it told the sales team exactly how warm that lead was and what they cared about.
That precision is only possible when the webinar platform is fully integrated with the CRM and MAP. Without it, webinar attendance stays in the "marketing did a thing" bucket — noted, but disconnected from the revenue conversation.
Most of our customers connect at least one integration. Many connect more than one, layering CRM data with MAP workflows and Slack notifications so that the moment a high-value prospect engages, the right people know about it in real time.
If your webinar platform isn't connected to your CRM and marketing automation platform, that's the single highest leverage fix available to you right now. Start there.
Once the integration is live, build a scoring model that accounts for webinar behavior specifically. An attendee who asked two questions, clicked three resources, and watched 90% of the recording should look very different in your CRM than someone who joined for five minutes and dropped.
When your sales team can see that distinction, they can prioritize accordingly, and your webinar program begins showing up in the revenue conversation.
Benchmark Scorecard
You've made it through a lot of data. This section pulls it all together into a single reference you can return to throughout the year; it’s a snapshot of what the average B2B webinar program looked like in 2025, and a checklist for making sure yours is set up for success.
Bookmark this page. Check back quarterly. Use it to identify where you're ahead of the curve and where there's room to close the gap.
Planning checklist:
- Speakers: 3-4 per webinar
- Webinar length: 45-60 mins for standard sessions; 30 mins for focused, single-topic sessions
- Format: Consider pre-recorded for repeatable content, regulated topics, or multi-time zone coverage
- Day/time: Wednesday or Thursday for maximum registrations; Monday or Tuesday for higher attendance rates; check industry-specific timing for your vertical
- Naming: Include "webinar" or "series" in your title, if relevant
- Series: Commit to at least one recurring series in the next 12 months
- On-demand: Make every webinar available after the live event ends
- Repurposing: Plan out your content ecosystem before the event date
- CRM/MAP integration: Connect your webinar platform to your CRM and marketing automation platform so engagement data flows directly into your pipeline

Performance benchmarks:
- Average registrants: 251
- Average attendees: 102
- Attendance rate: 40%
- On-demand availability: 89.1%
- Series penetration: 31.2% of all webinars
- On-demand completion rate: 91%
- Live completion rate: 74%

Performance benchmarks:
- AI-generated clips: 97.8% of all clips
- Content Lab adoption: 73% of customers

Performance benchmarks:
- Average webinar length: 56.8 mins
- Average speakers per event: 3-4
- Average webinars per month: 4.7

Performance benchmarks:
- Engagement feature adoption
- Chats: 62.3%
- Q&A: 56.1%
- Resource links: 35.1%
- Polls: 19%
- CTAs: 17.8%
The benchmarks above are a starting point, not a ceiling. We encourage you to use them as a baseline to push further.
Based on what you’ve seen, pick two or three metrics where your program is currently underperforming and treat them as your priority focus for the next quarter. Small, deliberate improvements compound quickly when webinars are running at the cadence the data shows is now standard (nearly five per month).
The goal here is to keep moving in the right direction, consistently, with the data to prove it.
Webinars of the Future
It's clear that webinars are a channel that has already transformed and is now setting the pace for what B2B marketing looks like at scale.
Some things in this report held steady year over year, while others changed dramatically. Series have gone mainstream. AI generates 98% of the clips. On-demand viewers finish the whole recording. It’s clear that what worked in 2022 won’t allow you to keep pace now.
Here are five trends we predict will continue in the coming years:
Agentic workflows across the full lifecycle
Right now, most AI tools assist with individual tasks: clipping a recording, drafting a social post, generating a follow-up email. AI agents, however, are the next frontier.
AI agents run the entire pre-to-post webinar lifecycle, without being asked. Scheduling, promotion, invitation personalization, real-time adjustment based on audience signals, post-event follow-up, content repurposing — all of it is orchestrated automatically, with the marketer themselves shifting from operator to orchestrator.
AI editing and production
The gap between raw recording and polished, publishable content is closing fast. AI video editors are already adding captions, trimming dead air, and surfacing the best moments from an hour of footage in minutes. The next generation goes further: B-roll, transitions, brand elements, and formatting applied automatically from a natural-language prompt.
Teams that used to spend half a day editing a single clip will now spend minutes. Goldcast's Agentic Video Editor is already moving in this direction, and it’s worth exploring if post-production time is eating into your team's bandwidth.
AI branding agents
As AI generates more content at higher volume, brand consistency becomes both more critical and harder to maintain on your own. We anticipate that more branding agents will review AI-generated output, flag anything that drifts from guidelines, and regenerate it to match. The more content you produce, the more valuable this layer becomes.
Interactive and immersive formats
The one-size-fits-all webinar experience is on its way out. Real-time audience personalization, AI-moderated Q&A that routes questions to the right speaker, and dynamic content paths that adapt based on poll responses are the formats audiences will come to expect. The webinar of the future feels less like a broadcast and more like a conversation that proactively responds to the room.
Webinars as the B2B content production engine
The data in Section 14 proves this is already happening, but it will only deepen. Webinars will stop being seen as a marketing channel and become the primary content production engine for B2B companies. One recording fuels a quarter's worth of clips, blogs, emails, social posts, sales enablement assets, and newsletter segments. The event itself is the raw material, and the content ecosystem it generates is the final product.
The organizations that internalize this now are the ones that will define what B2B marketing looks like in the next three years. The benchmarks are here. The tools are here. The only thing left is to use them.
Put it to Work with Goldcast
The data in this report tells a clear story: Webinars have become one of the most powerful and scalable tools available to B2B marketers. They build Mindshare, qualify buyers, generate pipeline, and fuel content strategies that keep working long after the live event ends.
And with AI now embedded in the production workflow, the ceiling on what a well-run webinar program can produce has never been higher.
But the benchmarks only matter if you use them. Show up consistently, treat every event as a content asset, and implement the right infrastructure to turn audience engagement into revenue.
If this report sparked ideas for how to improve your program, we'd love to help you act on them. Whether you're just getting started or looking to take an established program to the next level, Goldcast is built to support you at every stage: from pre-recording in our studio, to hosting a live event, to repurposing every webinar into content that compounds.

And if you want to keep building, explore these resources:
[Events] [Content Lab — try it free] [Goldcast Agents] [Recording Studio]
Stay In Touch
Platform
Resources
Company
© 2026 Copyright Goldcast, Inc. All rights reserved.
YOUR PRIVACY CHOICES