Video Metrics That Drive Pipeline (and How to Measure Them with Goldcast)

Table of Contents
Maximize Your Marketing ROI
Join 10,000 other marketers already getting the best tips on running engaging events that boost pipeline and create raving fans.
In B2B, video metrics are your early warning system. They signal deals that begin brewing months before the first sales call. Which is why you can’t afford to leave them to guesswork.
Here’s your straightforward guide to the video metrics that predict pipeline success (and how to track them).
Why video metrics matter
Most buyers won’t even consider a vendor they’ve never heard of. Without video in your marketing mix, you're likely to get filtered out before the real buying process even starts.
According to the data:
- 73% of B2B buyers prefer video over text when researching solutions
- 88% of video marketers report increased product understanding
- 87% see direct impact on sales
“The majority of marketers are now using video for lead generation on LinkedIn,” says Alex Rynne, Senior Content Marketing Manager, Marketing Solutions at LinkedIn. “Some folks think video is just a top-of-funnel activity, but it's very much not.”
According to LinkedIn’s latest B2B Marketing Benchmark Report, 85% of B2B marketers use video for lead generation.
The secret is choosing metrics that show real engagement, not surface-level interactions.
➡️ Want Alex's complete playbook for B2B video? Grab the Marketer's Survival Guide.
Which video metrics correlate with pipeline performance?
Video metrics are your crystal ball into buyer behavior, revealing who's paying attention long before they hit your pipeline. Here are our top 5 video performance metrics to track.
1. View count
You’re probably already using view count to understand how consistently you're showing up across your entire video ecosystem.
Top distribution channels to track according to our data:
- Social media (87%)
- Landing pages (46%)
- Email campaigns (44%)
Keep in mind that in a zero-click environment, quality of views matters more than quantity.
Don’t just look at how many people watched. To put your views in context, look at:
- Direct traffic increases after content campaigns
- Branded search volume over time
- Engagement quality rather than quantity
🎬Take action: Use video marketing tools that track cross-channel performance to let you know which distribution channels drive the highest number of qualified views and leads.
2. Engagement
Likes. Shares. Reposts. In a world where up to 60% of content is consumed without a click, engagement is the name of the game.
According to LinkedIn’s data:
- Video generates 5x more clicks than static posts
- Video drives 3x the engagement of text-based posts
- 60% of LinkedIn engagement happens on mobile
The right content engagement metrics can show you how well you're capturing mindshare—before traditional buying signals appear. For top-of-funnel, social engagements might be your top performance indicator. For mid-funnel goals, you might focus on the feature demos getting the most watch time.
With AI-powered repurposing, you can instantly see which parts of your videos are grabbing the most attention, then use them to drive even more engagement.
Our data shows that 90% of marketers are already repurposing video content into other engagement-boosting assets, including:
- Social media posts (77%)
- Emails (42%)
- Blog posts (36%)
🎬Take action: Create a "highlight reel" of high-engagement micro video moments from your top webinars to fuel your social media and email campaigns.
3. Conversion rate
According to Wyzowl’s latest data, 49% of marketers measure video ROI through leads and/or clicks.
Because while mindshare starts with awareness, conversion metrics show how effectively you're turning attention into action.
According to Wistia:
- 30 to 60 minute videos are the best at converting viewers
- Lead gen forms pack the biggest punch with 24% conversion
- CTAs drive action at 16% conversion
- Annotation links trail at 3% conversion
🎬Take action: Create automated nurture campaigns based on viewing behavior. If someone drops off at a specific point, trigger a personalized follow-up with the next relevant segment.
4. Play rate
Play rate is the ratio of viewers who press play to watch your video vs. those who scroll past it. And it’s a great indicator of how well your thumbnails and titles are capturing the visitor’s attention.
Here’s what the Wistia data has to say (% of visitors who hit play by web page):
- Blog - 11%
- Case study - 8%
- Contact - 32%
- Events - 17%
- Home - 17%
🎬Take action: With marketers allocating 10-25% of their budget to video, first impressions are critical. Use captions, make your value clear immediately, and test your thumbnails to find out which ones drive the most clicks.
5. Completion rate
Video completion rate lets you know how many people watch your videos from beginning to end. According to Wistia, engagement rates are higher on shorter videos—but keep in mind that even a lower completion rate on a longer video may mean higher overall watch time.
Here’s the data:
- >1 minute - 50%
- 1-3 minutes - 46%
- 3-5 minutes - 45%
- 5-30 minutes - 38%
- 30-60 minutes - 25%
- >60 minutes - 17%
🎬Take action: Think of longer videos like a good book—they need chapters! Let AI do the heavy lifting by spotting natural places to add breaks. Viewers can watch at their own pace and jump back in right where they left off.
Goldcast-hosted events have 64% completion rates compared to 45% industry average.
Learn how hundreds of brands are scaling video.
How does Goldcast help track these KPIs?
Goldcast's Reporting & Analytics makes measuring mindshare growth and pipeline impact as easy as 1, 2, 3:
- Track all channels at once (no spreadsheet chaos)
- See direct pipeline dollars (not just views)
- Get fresh data in under 2 hours
Cross-platform reporting
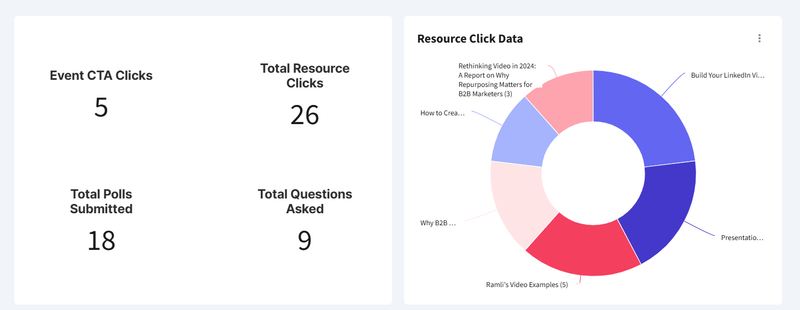
Your CMO wants to know how video drives pipeline. Your sales team needs to know which accounts are most engaged. With Goldcast's integrated dashboards, you get both—plus everything in between.
Track engagement during live sessions, measure performance across your entire video library, and connect content directly to revenue.
A simple interface makes it easy to surface the metrics that matter most, whether you're optimizing content strategy or proving ROI to leadership.
Deep integrations
No more data silos. Goldcast connects seamlessly with your existing tech stack—from HubSpot and Salesforce to Marketo and beyond.
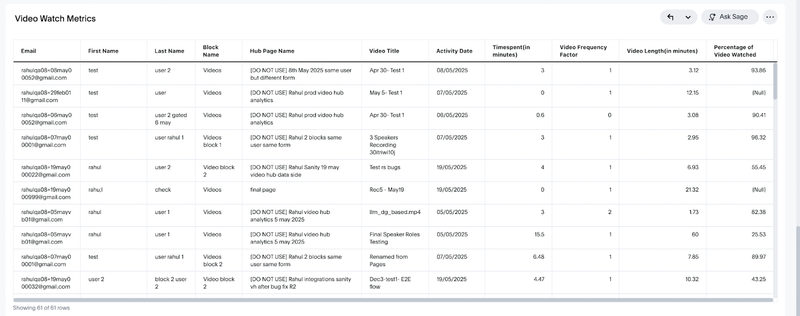
Send video engagement data directly to your CRM, enrich lead scores based on viewing behavior, and trigger automated follow-up when prospects show intent:
Jane Doe (jane@example.com) watched “Product Demo” on the "Launch Hub" page, spending 8 minutes across 2 sessions and completing 80% of the video.
With two-way sync capabilities, your sales team gets real-time alerts right where they work, helping them strike while the iron's hot.
Immediate data handoff
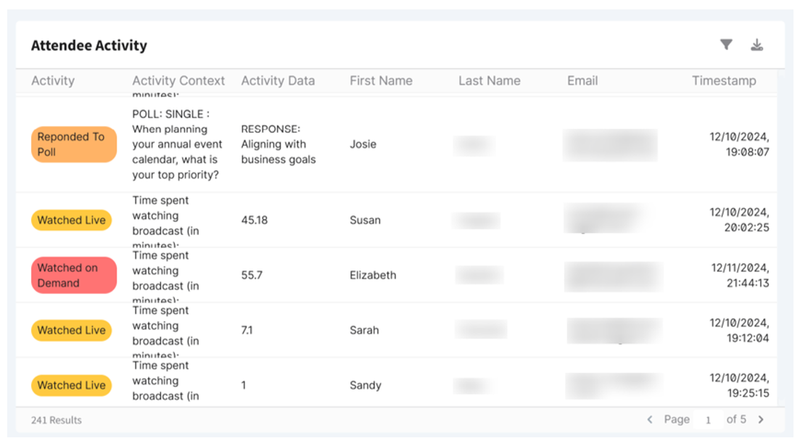
Speed wins deals. That's why Goldcast refreshes analytics within 2 hours post-event, not days. This quick turnaround means your sales team can follow up while your brand is still top of mind.
Just ask Kochava. By feeding event recordings into Content Lab, they automated the creation of social video snippets and blog posts from transcripts. The results? 15,000+ social video impressions, 75% faster blog production, and multiple closed-won deals attributed to their webinar content.
They can see exactly which features caught attention, what resources were downloaded, and even which questions were asked—everything needed for a personalized follow-up that moves deals forward.
What to do when metrics falter
Numbers down? Don't panic. Even top-performing content needs a refresh sometimes. Here's your game plan for when engagement dips:
Identify the drop-off points
Use Goldcast's AI-powered insights to pinpoint exactly where viewers lose interest. Is it during a specific topic? Around the same timestamp? This data helps you understand what's working (and what's not) with your audience.
Test and optimize
- A/B test thumbnails and titles to boost play rates
- Try different content formats to keep your brand fresh
- Add interactive elements like polls at key moments
- Break longer content into snackable segments
Amplify what works
When you spot high-performing segments, put them to work:
- Turn engaging moments into social media clips
- Use popular segments to create email teasers
- Repurpose top content across different channels
The goal isn't just better metrics—it's sustainable mindshare that drives pipeline. Focus on quality over quantity. Are the right people engaging? Are deals moving faster? If yes, you're on the right track.
FAQs
Which video metrics best predict pipeline impact?
While all metrics matter, engagement rate and view depth are the strongest pipeline indicators. High completion rates (25%+ for long-form content) combined with active engagement (comments, resource clicks) can also signal buying intent.
How quickly can I access video performance data in Goldcast?
Goldcast refreshes analytics within 2 hours post-event. Real-time engagement metrics are available during live sessions, with comprehensive performance data accessible shortly after events conclude.
What dashboard shows cross-event performance trends?
Goldcast's analytics dashboard provides both event-specific and organizational-level insights. The cross-event dashboard displays trends across your entire video content library, from webinars to product demos.
How do I leverage AI recommendations to optimize performance?
Goldcast's AI analyzes engagement patterns to automatically identify high-performing segments and recommend optimal clip lengths, thumbnail options, and distribution timing to help you maximize both live attendance and on-demand viewing.
What's the best way to track video ROI across different channels?
Goldcast integrates with major CRM and marketing platforms to unify video analytics across channels. By integrating Goldcast with tools like HubSpot, Salesforce, and Marketo, you can track performance from initial views through pipeline contribution.
From metrics to pipeline impact
Video is no longer just a top-of-funnel tactic—it's your secret weapon for building lasting mindshare that converts. By tracking the right metrics and using video automation to optimize your strategy, you can create content that resonates with buyers long before they're ready to purchase.
Start with these five key metrics, use Goldcast's analytics to understand what drives engagement, and keep optimizing based on real performance data. Whether you're running product demos, hosting webinars, or building a content hub, the right metrics will help you prove—and improve—your video ROI.
Ready to turn your video content into a pipeline engine? Book a demo to see how Goldcast can help you measure and maximize your video performance.
Transform Your Video Marketing with AI
Stay In Touch
Platform
Resources
Company
© 2026 Copyright Goldcast, Inc. All rights reserved.
YOUR PRIVACY CHOICES



 Upcoming Events
 Event Series
 On-Demand Events