


 Upcoming Events
 Event Series
 On-Demand Events


Analytics and Dashboards
Powerful analytics to drive video performance and event success
Understand your viewers and optimize your video and events to drive better performance and ROI.
Loved by B2B marketers for our power analytics
Improve event and video performance with easily accessible, actionable analytics
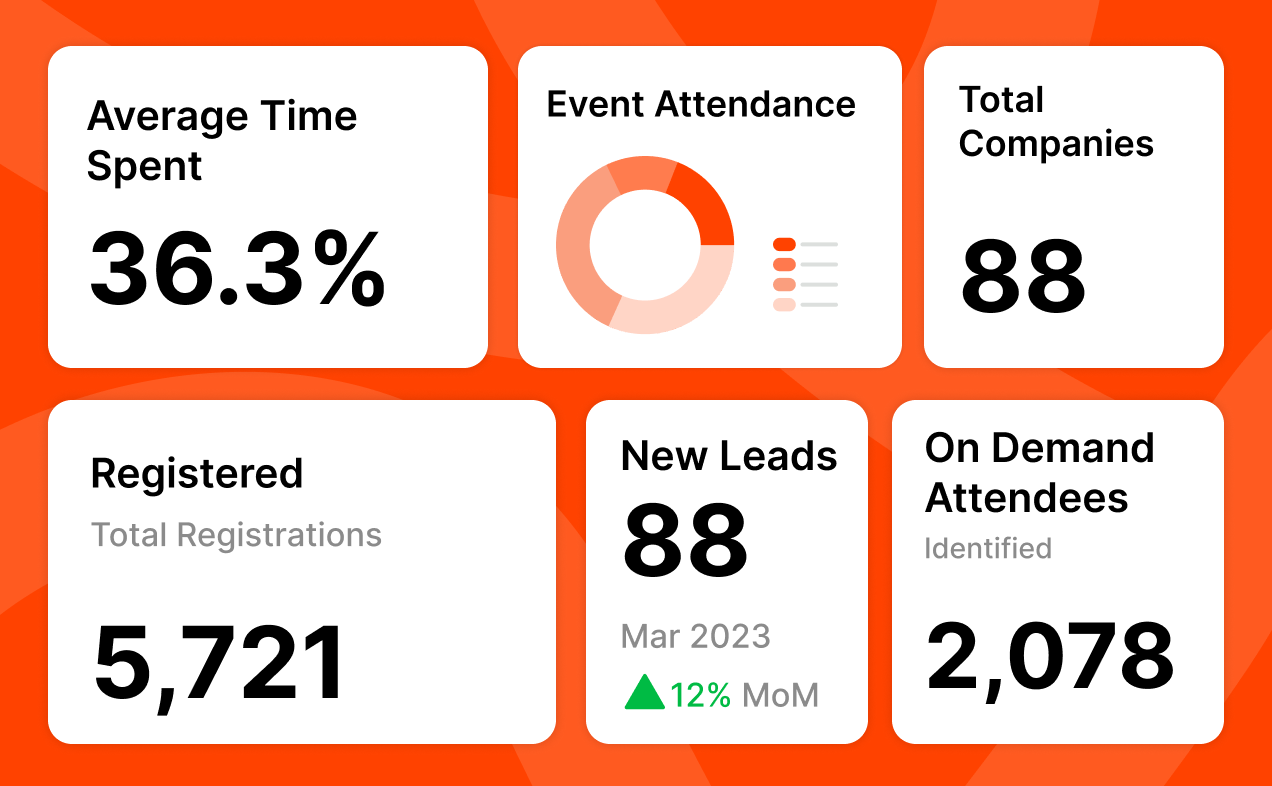
Measure metrics that matter
Track attendee behavior, uncover trends, and share insights effortlessly. Access data in Goldcast or sync with your go-to tools.
- Get detailed insights across multiple events.
- Spot most active prospects and identify trends.
- Get in-depth insights by making your own custom reports.
“Goldcast has been the cleanest and most effective event tool I have used in my career thus far. Everything from the custom landing pages to the majorly detailed analytics we can share with our partners post event are so helpful. I have reduced my post event consolidation time by at least an hour per event.”

Sarah Stolusky
Manager, Field Marketing Events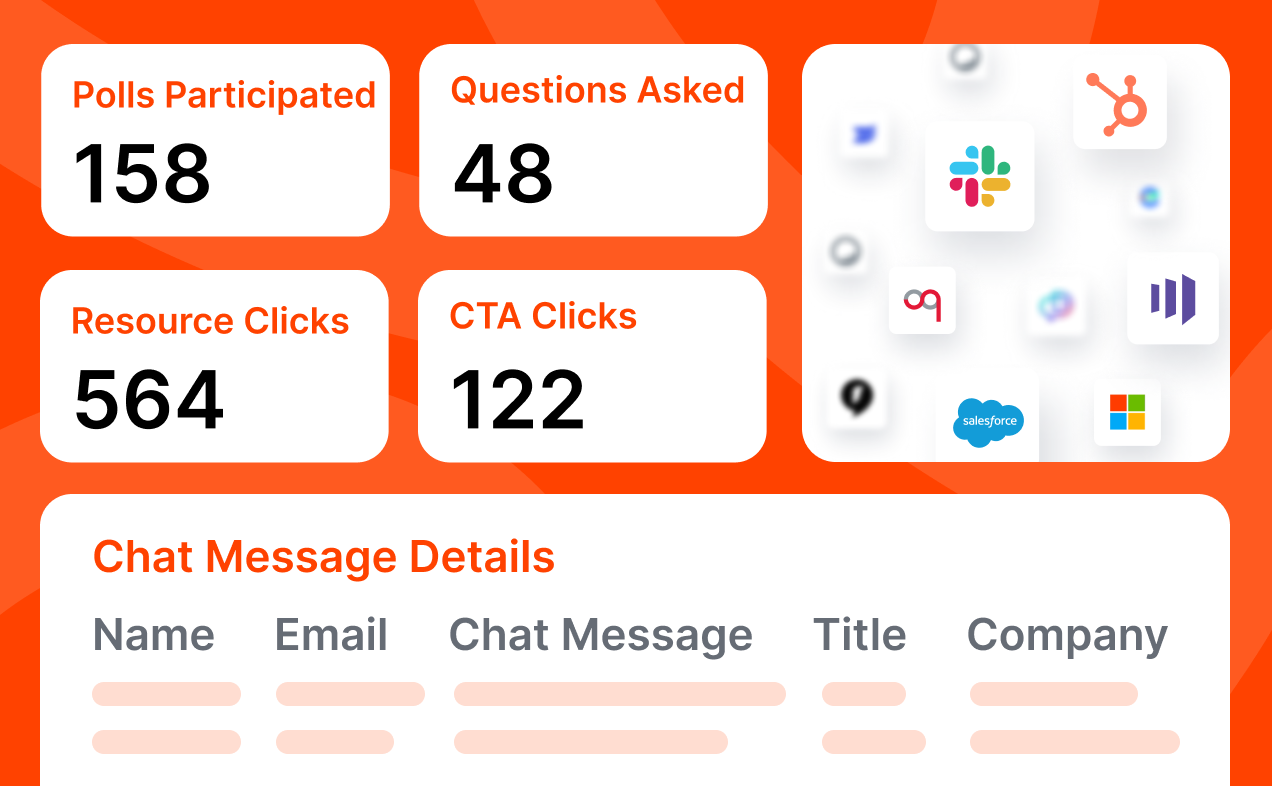
Turn engagement metrics into follow-up gold
Use engagement data to drive smarter follow-up strategies.
- Use 16+ activity triggers to gauge engagement.
- Gain insights into attendee actions across sessions, booths, and rooms.
- Measure email performance: opens, clicks, bounces, and more.
“We love Goldcast's reporting capabilities. Helps us save a ton of time building these reports manually!"

Davi Schmidt
Former Demand Generation Leader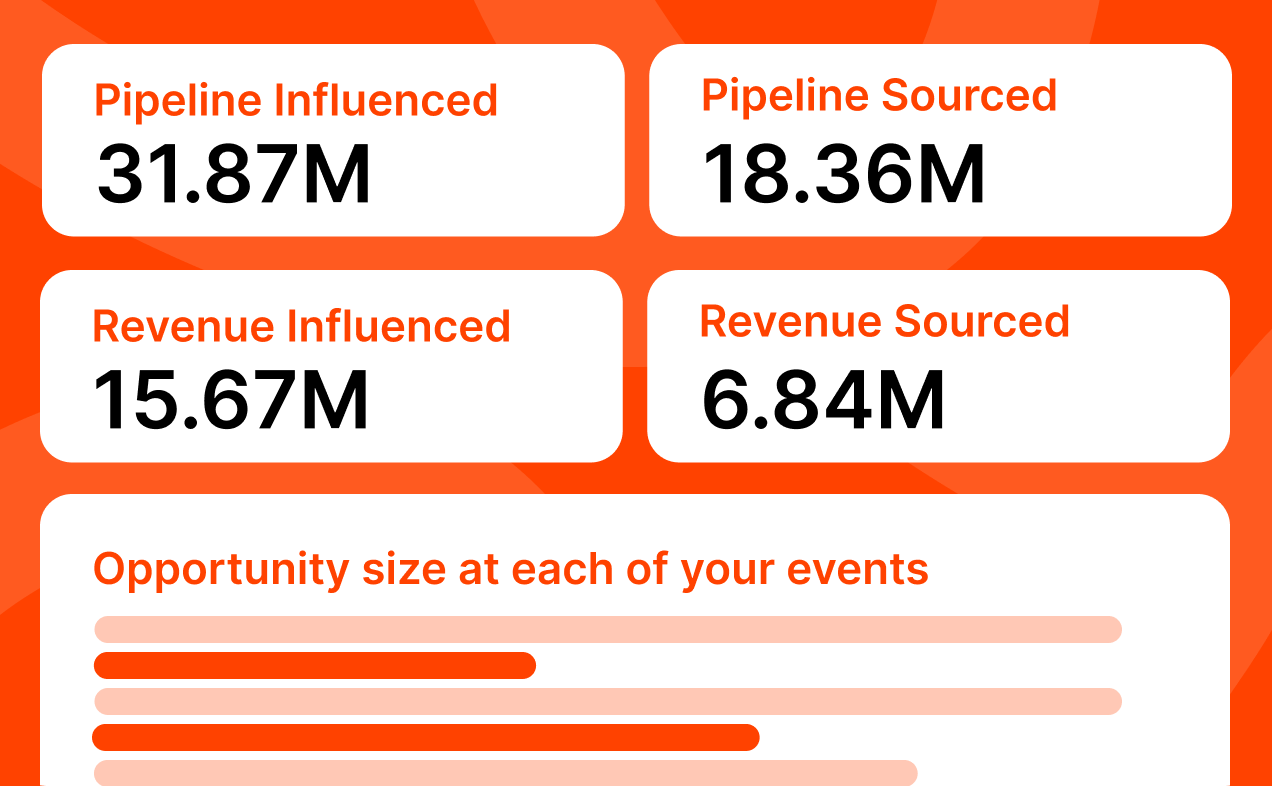
Justify your budget and prove event ROI
Get clear metrics to justify your budget, prove event ROI and help your sales teams target the most engaged accounts.
- Assess post-event performance through pipeline and revenue metrics.
- Identify highly engaged accounts for sales to outbound.
- Easily share event ROI with your team showcasing the impact of your efforts.
“Super actionable event data for personalized sales follow-up that drove 35% more demo conversion.”
Amanda Elam
CMO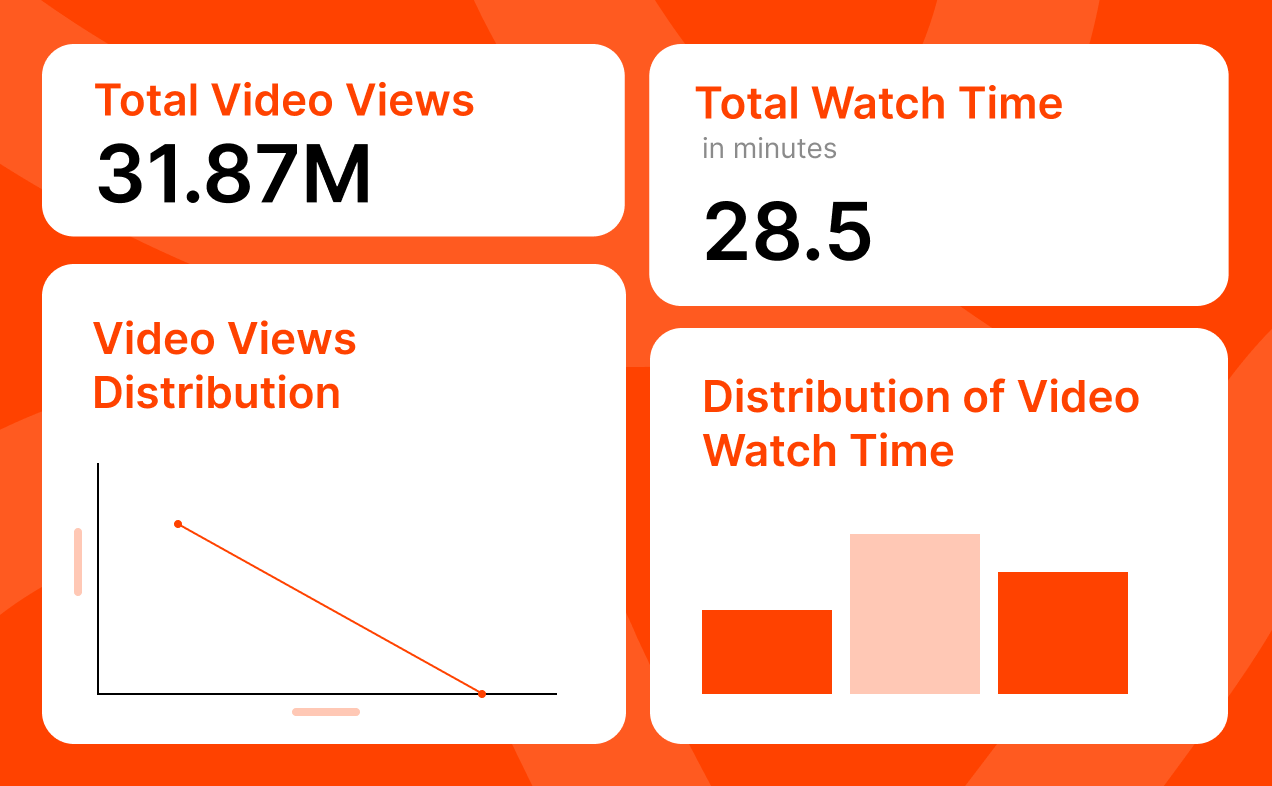
Confidently optimize your video marketing strategy
Unlock actionable insights across your videos and optimize your video marketing strategy.
- Track video engagement on your video hubs or embedded videos.
- Capture key data points like audience engagement and user interactions.
- Assess content effectiveness with real-time data.
"Goldcast has transformed the way our team uses video content across various disciplines."

Mollie Becker
Demand Generation Manager“I can attest, some of the best and clearest metrics I have seen from my webinars as a product marketer have been from when I used Goldcast. It really helped me understand our customer's behavior and seeing all the historical engagement gave me additional content ideas.”

Bobbie Jo Gregor
Former Senior Product Marketing Manager
READY TO TURN INSIGHTS INTO ACTION?
Discover how Goldcast’s analytics is helping teams track performance and optimize their video content.
READY TO TURN INSIGHTS INTO ACTION?
Discover how Goldcast’s analytics is helping teams track performance and optimize their video content.
Stay In Touch
Platform
Resources
Company
© 2026 Copyright Goldcast, Inc. All rights reserved.
YOUR PRIVACY CHOICES