


 Upcoming Events
 Event Series
 On-Demand Events


Marketing Analytics: How Wiz Uses Event Data to Tell a Story
Maximize Your Marketing ROI
Join 10,000 other marketers already getting the best tips on running engaging events that boost pipeline and create raving fans.
As Event Marketers, you’re uniquely positioned to help guide your organization to success. Event data is more than just a way to measure event performance. B2B Marketers can also use this data to guide decision-making, like where to allocate marketing spending or make improvements.
We sat down with Liz Kokoska, Head of Lead Generation at Wiz, where she shared insights on what she’s learned working at the fastest-growing software company.
Be sure to check out Liz’s on-demand session and read on for the key takeaways below. ⤵️
Takeaway 1: Use your event data to tell a story
Times have changed for Event Marketers. The data we gather from virtual and in-person events today is so different from what it was like a decade ago.
With the type of information we are now able to collect, data can be a useful tool to not only evaluate event performance but also allow you to be more strategic with your planning and aligning with business objectives, producing more quality leads, and gaining insight into what matters most to your attendees.
But for you to become a strategic partner for the organization, you have to use this granular data to show the value of the work you’re doing– you have to tell your story.
You need to be able to answer these questions:
- How well are your programs performing?
- How are you tracking against goals?
- Which channels are driving the most pipeline?
- Where should you be focusing your dollars?
- How many net-new leads are coming?
- How many events are leads attending before they become an opportunity?
This helps you understand if your events are providing value for the organization and whether or not you need to change up the programs or rethink your content and format going forward.
And the key to gathering all this data is getting internal buy-in from execs and the rest of the team. You want to get sales involved early and often if you want your program to be successful. You have to sell your story, and having this data can help you get the internal alignment with your plan before you execute your strategy and begin promoting the product.
Takeaway 2: Rethink how you measure success 💡
Think about what type of events can fall within the marketing funnel and deliver desired results (ToFu, MoFu, BoFu). Not all events are created equal, so you may have different metrics based on the event type and where they sit in the funnel.
But if we look at how Wiz does it, Liz says that the pipeline is queen. Of course, there is a bit more nuance. When looking at the overall picture, here are some key metrics you can use to help measure the success of your program:
- Target ICP (lead score): By creating profiles of your ideal customer, you will be able to create events targeted specifically for them which ultimately generates higher quality leads that convert to opportunities.
- Lead projections: Lead projections can be difficult to ascertain for new programs, but you can use past events to better understand what to expect.
- Pipeline attribution: Who’s going to get credit? This needs to be a conversation within the organization. Liz has worked for companies that looked at the last touch and first touch. However, the most important factor is everyone agrees on the attribution model and determines what percentage of lead generation each team is supposed to drive.
- Conversion rate: The conversion rate helps you accurately assess the success of each program and event to see if the content is resonating with people, if the format is working, and if there are any areas for improvement.
- Account engagement: How engaged are leads with your events? Are they repeat attendees? Account engagement can help you figure out how likely someone is to convert to an opportunity in the future where sales can finally close the deal.
Of course, there are more KPIs that you can track, such as new registrations, net new leads, etc. But your organization will have to discuss which ones are important for the company’s goals. However, these five are a great place to start to understand how well your programs perform.
Remember, data is critical for driving decision-making so you can understand where the existing opportunities are, where you need to allocate resources, and better plan to align with the organization’s goals and objectives.
Takeaway 3: Analytics dashboards are your friend 📊
However, data is useless if it isn’t readily available in a digestible format. That’s where analytics dashboards come in. Using dashboards to track event metrics gives everyone a single source of truth. That way, you can make sure everyone is looking at the same data.
Luckily, tools such as Salesforce and Tableau make it much easier to accomplish this.
Let’s look at some examples of how to use analytics dashboards.
Funnel dashboard
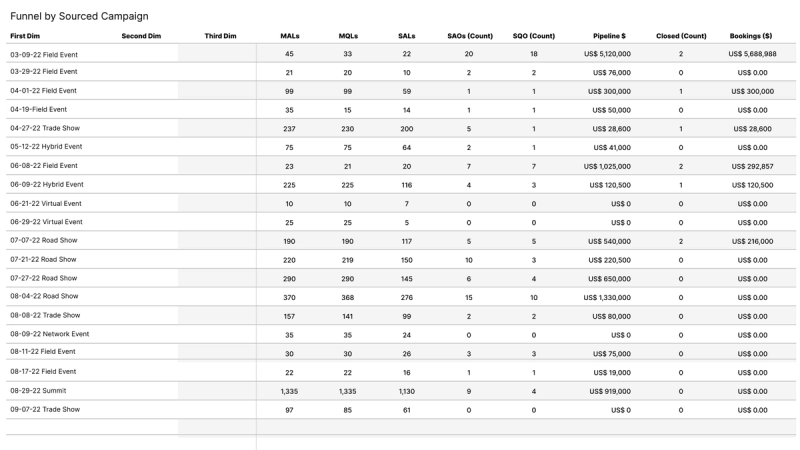
Looking at the image above, you can see how you can slice and dice the data. With the funnel dashboard on the left, you can see all the event names alongside all the leads that came in. You can also see your MALs, MQLS, and all the way through to your bookings. You can even break it down further to see it by campaign manager, event type, channel, etc. This is a fantastic way to see how your funnel is moving along. Plus, it’s also a great tool for managers to understand how each marketer is performing.
Lead dashboard
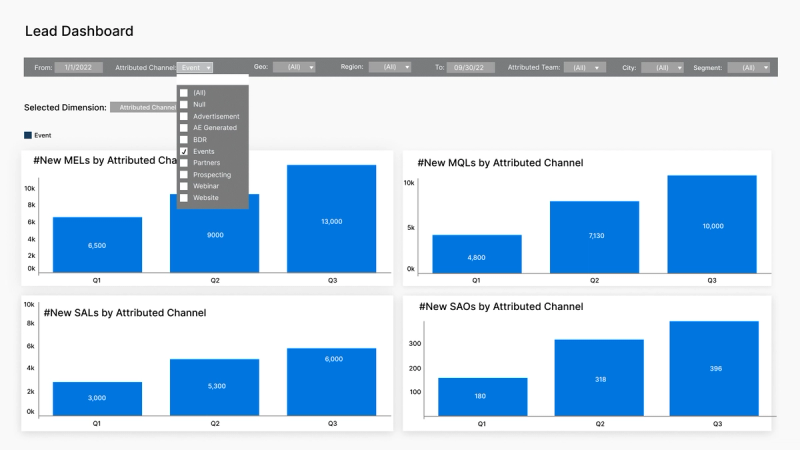
Although it’s a simplified version, this gives you an idea of what the Tableau dashboard can give you. As you can see, there are a ton of filters you can use where you can see MELs, SALs, SAOs, and more. And you can also dig even deeper to see how different dimensions’ performance breaks down by region, event type, campaign, channel, campaign marketer, and more. Or you can check how the funnel is going by channel or whatever is relevant to you. All of this lets you track how your targeting against goals MoM or QoQ.
Event performance dashboard
This dashboard gives you detailed information on how your event performs. It shows data such as new registrations, attended, did not attend, etc. Using this info, you can gauge whether the time of year affects your attendance level or something else, such as the format or content. If you start noticing a dip in your attendance rate, you can devise a strategy to get more people to show up. And same goes for the did-not attends–what can you do to follow up with people to figure out why they signed up but didn’t show up?
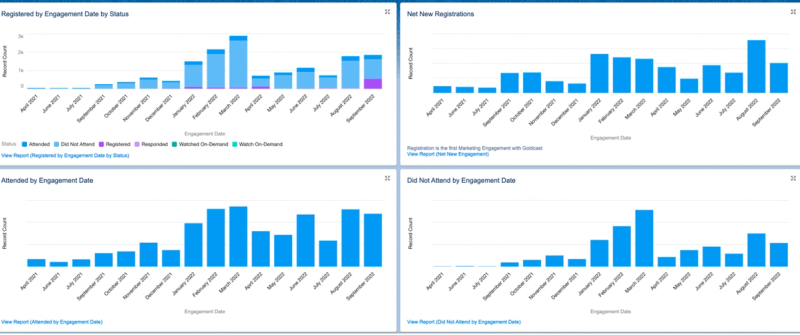
Additionally, the Event Performance Dashboard can help you tease out new opportunities. Source Opps shows you what specific event types or campaigns generate new leads. Accelerated Opps shows you the existing opportunities, so you track those people who’re attending your bottom-of-funnel events. Looking across the bottom, you can also track how many events you’re holding each month by type to see how they perform. These include field events, webinars, community events, summits, etc. This can help with KPIs like lead projection by telling you if you execute “X” number of events, then you can expect “X” number of people to show up.

Marketing funnel dashboard
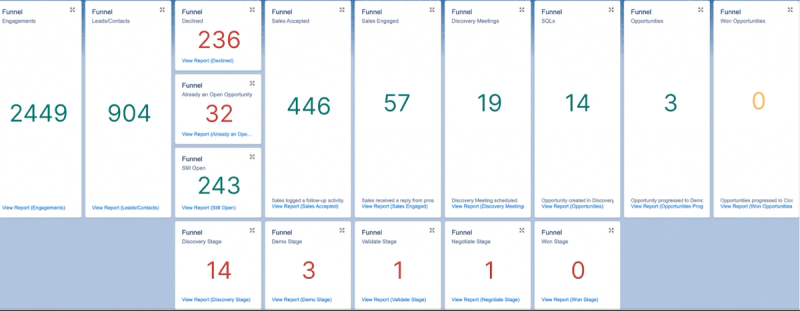
Finally, we have the Marketing Funnel Dashboard. This dashboard is useful for both sales and marketing. At Goldcast, we hold weekly meetings to review the top of the funnel and our pipeline. With this data, we get a snapshot of how people are engaging with our campaigns.
Of course, a lead can touch points with us from various campaigns, such as an event, a blog, or an on-demand video (be sure to check out the one above!). That’s how we’re able to track those engagements.
We can also see how many net new leads are generated and track where they’re coming from in the funnel. Additionally, we can track what leads have been disqualified and why.
Then we can track what leads are still open and need to be followed up on by sales– because that’s an important step to ensure those leads get converted.
Finally, the dashboard gives us key metrics such as SALs, sales engagement with them, and what SQLs and opportunities have come from that.
Transform Your Video Marketing with AI
Stay In Touch
Platform
Resources
Company
© 2026 Copyright Goldcast, Inc. All rights reserved.
YOUR PRIVACY CHOICES