October 2023 Product Updates: Early Access for Field Events, Eloqua Integration, Enhanced Analytics Dashboard, and More!

Maximize Your Marketing ROI
Join 10,000 other marketers already getting the best tips on running engaging events that boost pipeline and create raving fans.
Our monthly product updates blog returns!
We’re launching an early access for our Field Events solution that will go live later in fall. On the analytics side, our product team has worked hard on sprucing up the analytics dashboards and making it cleaner and more user-friendly. ✨
We also have a new and improved Goldcast + Eloqua integration that will be super valuable for nurturing those event leads!
Read on for more details about these updates👇
1. Goldcast Field Events (Early Access)
If you run in-person and field events as part of your events program, this will make you happy! You can now use one platform for all your events and have all data centralized on one platform.
A few of the exciting features we have in store:
Managing Registration
Use Goldcast’s registration page builder to create branded registration pages for your in-person field events.
Instant confirmation with QR codes
Registrants get instant confirmation emails and calendar holds, both of which contain a unique QR code, which makes check-in a breeze.
Effortless attendee check-in
Easily check-in attendees with a QR code, assigning access to staff to manage it onsite directly at the event using any device.
Attendance insights
Automatically sync attendance data to your CRM/MAP in real-time, removing frustrating manual work and reliability issues.
We’re positive this will be a game changer for your in-person events. Join the waitlist to be the first to get exciting updates!
📝 Sign up for waitlist here!
2. Goldcast + Eloqua Integration
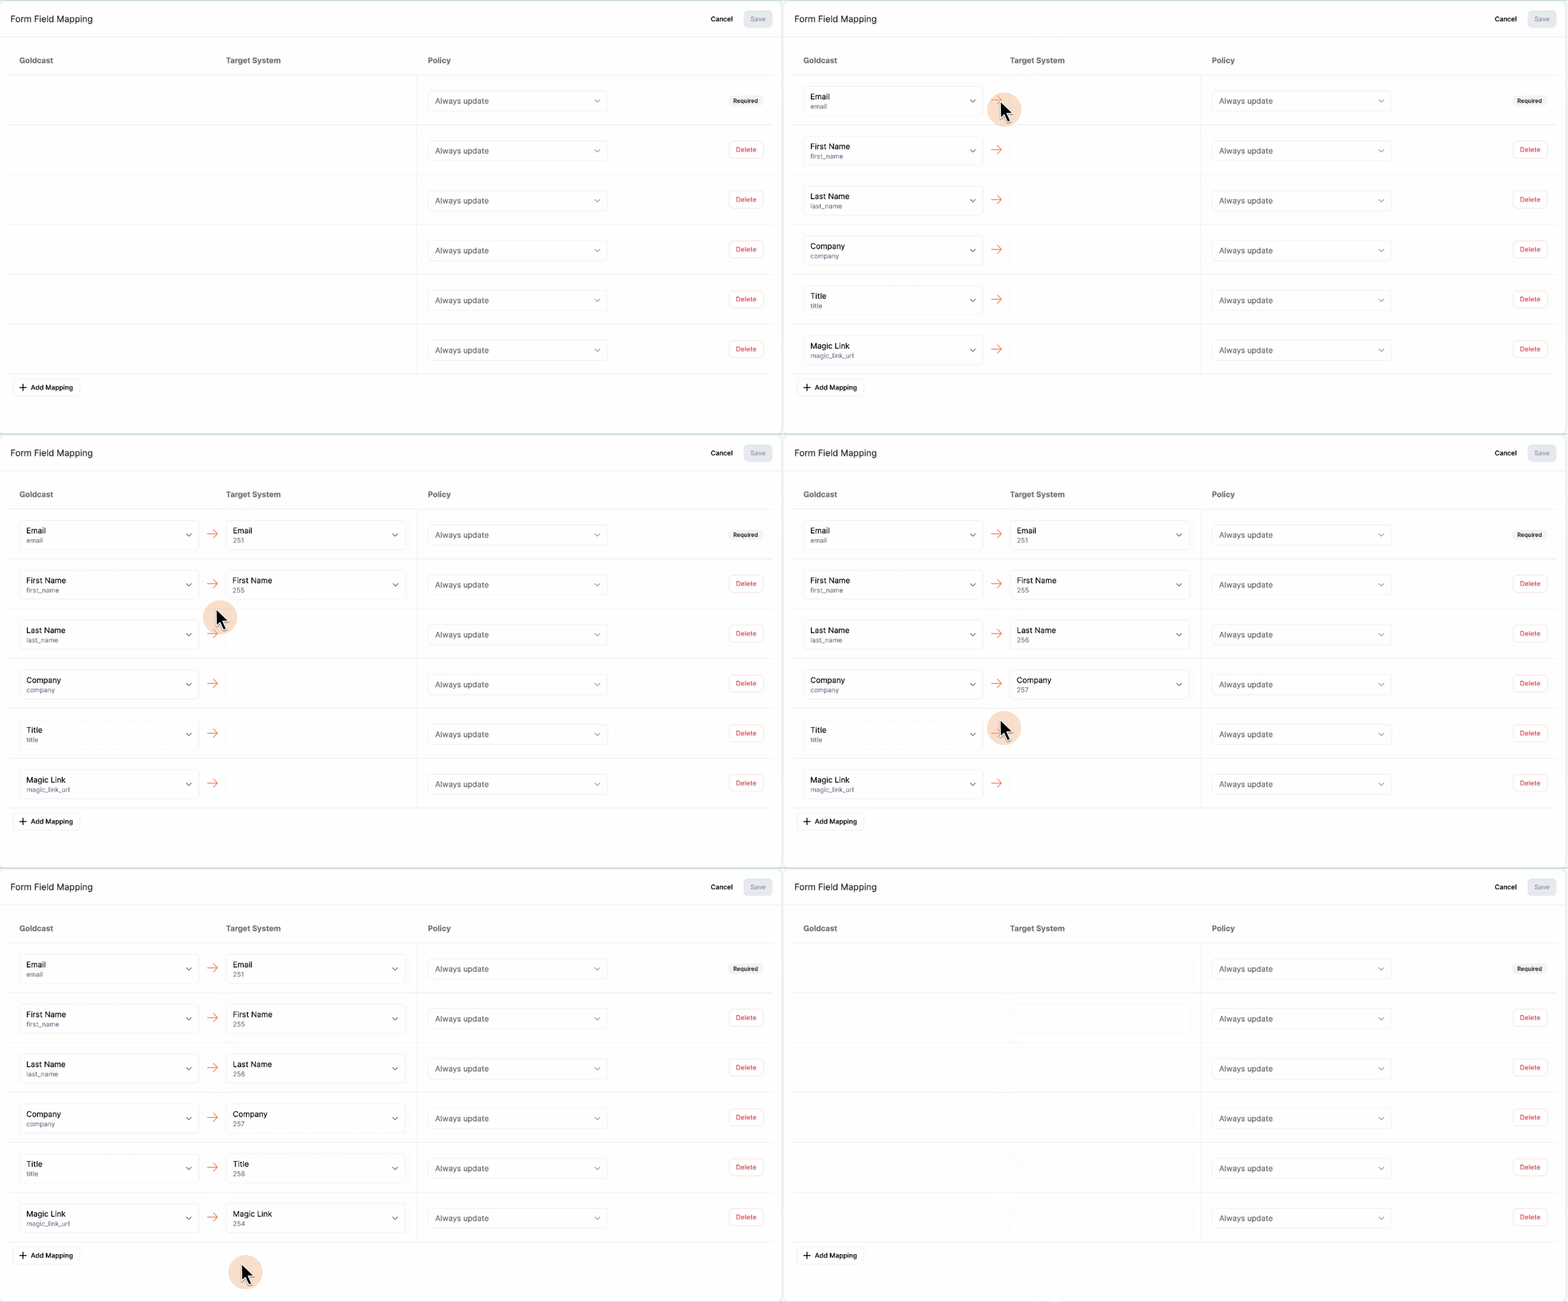
The new Goldcast + Eloqua integration is here! You can now streamline and automate the process of collecting and managing registrant and event engagement data.

You’ll be able to track and nurture event leads by mapping Goldcast event data to Eloqua form fields. Having accurate event data in Eloqua allows for more personalized and targeted marketing campaigns.
Whether it's an activity, such as attendee participation in an event session, or an active engagement, such as poll responses and clicks on CTA, this integration empowers you to:
- Send targeted follow-up emails.
- Efficiently segment your data.
- Implement lead scoring strategies.
- Nourish leads through personalized nurturing.
- Gain invaluable insights into your leads and customers.
What does this mean for you? Higher conversion rates, folks!
➕Learn more about the integration.
3. Enhanced Analytics Dashboard
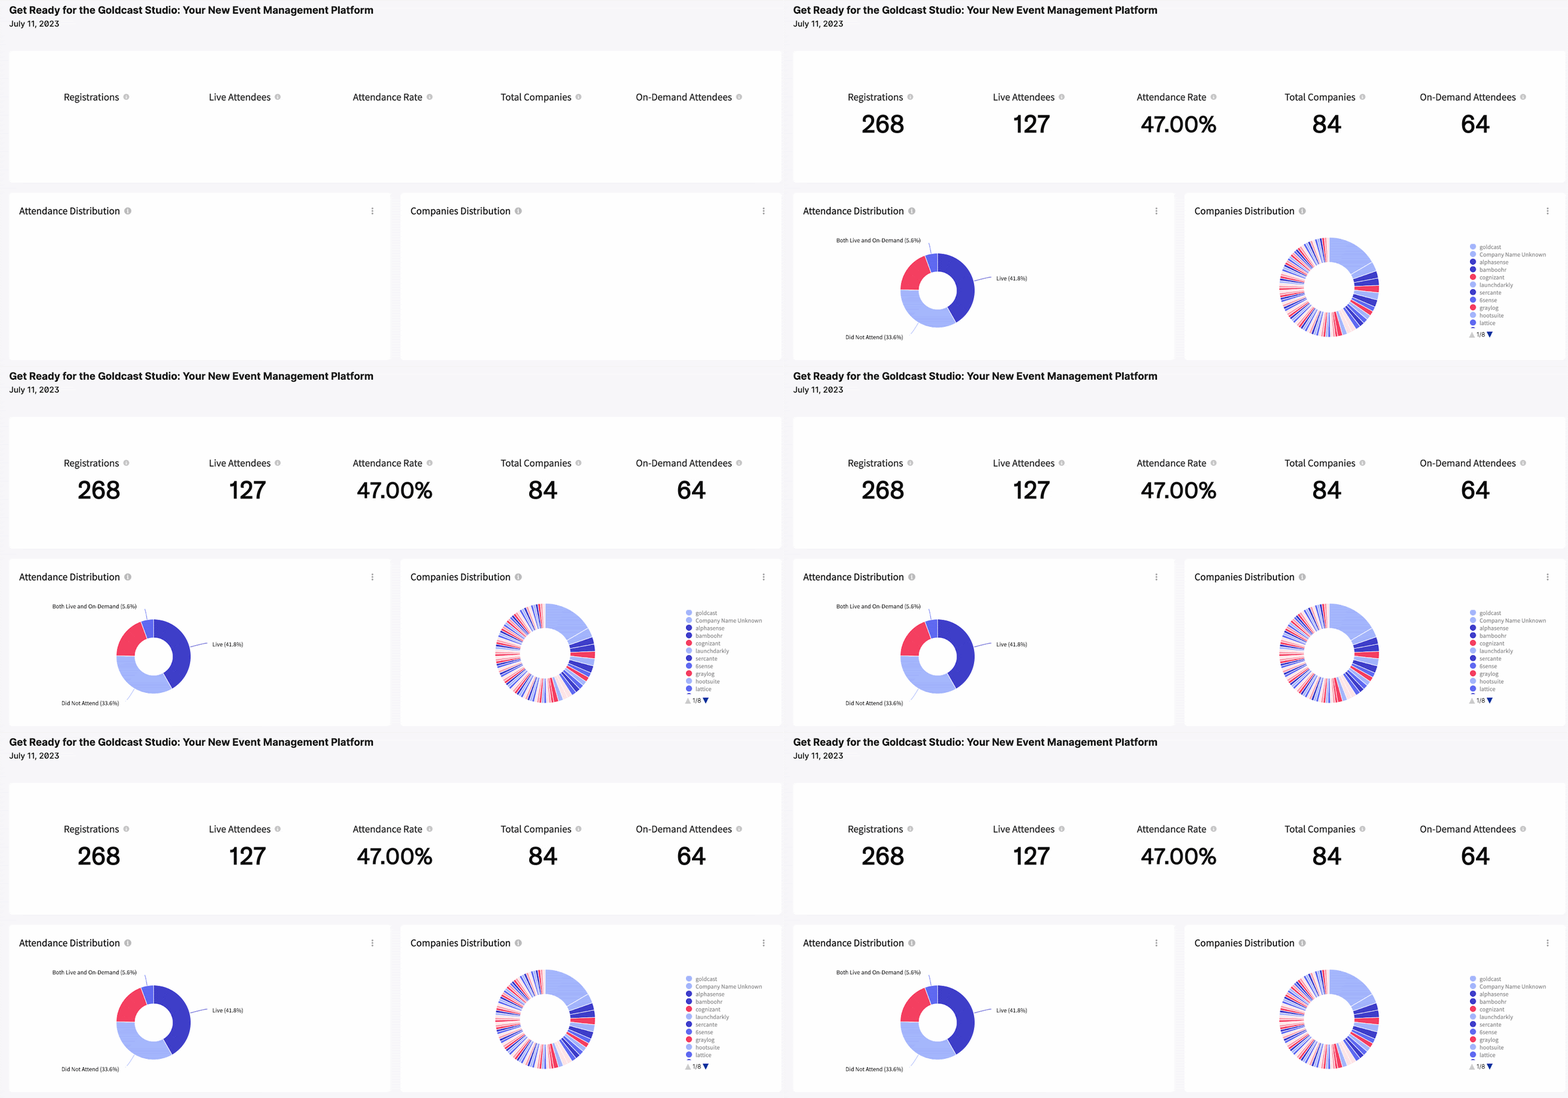
We have a few exciting updates to our analytics dashboard! Here’s a quick look into some of the updates we have made.
Enhanced Attendance Distribution Chart
The new and improved attendance distribution chart now has more detailed information on how many users attended the event live, how many watched it on-demand, and how many did both, and how many did not attend (number and percentage).

The Event Summary Table
We've transformed the Attendance Summary into the Event Summary table. You now have streamlined data access and export options.
Here's what's new:
- One table, multiple functions: Your central resource for registration data, magic links, attendance records, and event engagement counts, covering all registrants, not just attendees, for a comprehensive view.
- Direct magic link export: Customers can easily export event magic links themselves, presented as clickable links, now accessible for all event registrants (also available in the Pre-Event dashboard).
- Simplified event attendance status: A single column for intuitive filtering and sorting, with four possible values: Live, On-Demand, Live + On-Demand, or Did Not Attend.
- Customizable data tables: Choose which columns to display, offering a self-serve experience tailored to your needs.
- Enhanced chart export options: Export charts via email or in CSV, XLSX, or PDF formats for added flexibility
We've also improved the look and feel of the dashboard, making it cleaner, smoother, and more user-friendly.
📊More details here
Lightning round updates
Small but mighty, check out these additional upgrades ⤵️
- Webhook enhancements: Organizers can now sync all registration data, custom or standard fields, from Goldcast Registration Forms to your configured Webhooks setup. These changes will be applicable to two key event engagement activities 'Registered' and 'Attended'.
- Adding sessions to speakers: Organizers can now assign sessions to speakers when adding them to the event or editing speaker details.
- UTM tracking on Hubs: Organizers can track and analyze the sources (which marketing posts / campaigns) of traffic for registrants that came through a Goldcast event Hub.
That’s all for now. We’ll see you next month with more product updates! 👋

Transform Your Video Marketing with AI
Stay In Touch
Platform
Resources
© 2026 Copyright Goldcast, Inc. All rights reserved.


 Upcoming Events
 Event Series
 On-Demand Events

